
このページで
16 VMwareのカスタムパフォーマンスカウンター名作成
概要
VMware パフォーマンス カウンター パスのフォーマットはgroup/counter[rollup]です。
group- cpu などのパフォーマンス カウンター グループcounter- usagemhz などのパフォーマンス カウンター名rollup- averageなどのパフォーマンス カウンター ロールアップの種類
上記の例では次のカウンター パスが得られます: cpu/usagemhz[average]
パフォーマンス カウンター グループの説明、カウンター名、およびロールアップの種類については、VMware のドキュメントを参照してください。
Zabbix のスクリプト アイテムを使用して、内部名を取得し、カスタム パフォーマンス カウンター名を作成することもできます。
設定
- 次のパラメーターを使用して、メインの VMware ホスト (eventlog[] アイテムが存在する場所) で無効化されたスクリプト アイテムを作成します。
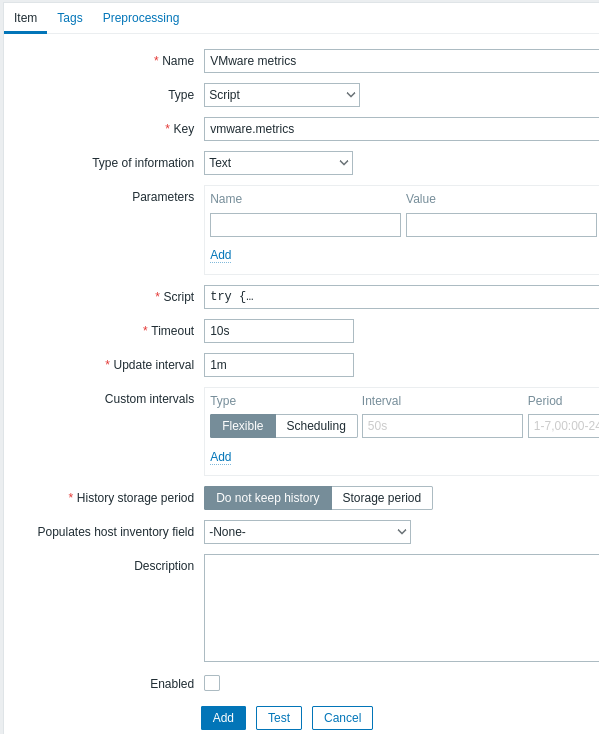
- 名前: VMware metrics
- タイプ: スクリプト
- キー: vmware.metrics
- データ型: テキスト
- スクリプト: 以下の スクリプト をコピーして貼り付けます
- タイムアウト: 10
- ヒストリの保存期間: ヒストリを保持しない
- 有効: チェックしない
スクリプト
try {
    Zabbix.log(4, 'vmware metrics script');

    var result, resp,
    req = new HttpRequest();
    req.addHeader('Content-Type: application/xml');
    req.addHeader('SOAPAction: "urn:vim25/6.0"');

    login = '<soapenv:Envelope xmlns:soapenv="http://schemas.xmlsoap.org/soap/envelope/" xmlns:urn="urn:vim25">\
    <soapenv:Header/>\
    <soapenv:Body>\
        <urn:Login>\
            <urn:_this type="SessionManager">SessionManager</urn:_this>\
            <urn:userName>{$VMWARE.USERNAME}</urn:userName>\
            <urn:password>{$VMWARE.PASSWORD}</urn:password>\
        </urn:Login>\
    </soapenv:Body>\
</soapenv:Envelope>'
    resp = req.post("{$VMWARE.URL}", login);
    if (req.getStatus() != 200) {
        throw 'Response code: '+req.getStatus();
    }

    query = '<soapenv:Envelope xmlns:soapenv="http://schemas.xmlsoap.org/soap/envelope/" xmlns:urn="urn:vim25">\
<soapenv:Header/>\
    <soapenv:Body>\
        <urn:RetrieveProperties>\
            <urn:_this type="PropertyCollector">propertyCollector</urn:_this>\
            <urn:specSet>\
                <urn:propSet>\
                   <urn:type>PerformanceManager</urn:type>\
                   <urn:pathSet>perfCounter</urn:pathSet>\
                </urn:propSet>\
                <urn:objectSet>\
                   <urn:obj type="PerformanceManager">PerfMgr</urn:obj>\
                </urn:objectSet>\
            </urn:specSet>\
        </urn:RetrieveProperties>\
    </soapenv:Body>\
</soapenv:Envelope>'
    resp = req.post("{$VMWARE.URL}", query);
    if (req.getStatus() != 200) {
        throw 'Response code: '+req.getStatus();
    }
    Zabbix.log(4, 'vmware metrics=' + resp);
    result = resp;

    logout = '<soapenv:Envelope xmlns:soapenv="http://schemas.xmlsoap.org/soap/envelope/" xmlns:urn="urn:vim25">\
    <soapenv:Header/>\
    <soapenv:Body>\
        <urn:Logout>\
            <urn:_this type="SessionManager">SessionManager</urn:_this>\
        </urn:Logout>\
    </soapenv:Body>\
</soapenv:Envelope>'

    resp = req.post("{$VMWARE.URL}",logout);
    if (req.getStatus() != 200) {
        throw 'Response code: '+req.getStatus();
    }

} catch (error) {
    Zabbix.log(4, 'vmware call failed : '+error);
    result = {};
}

return result;項目を設定後、テスト ボタンを押して、値の取得 を押します。
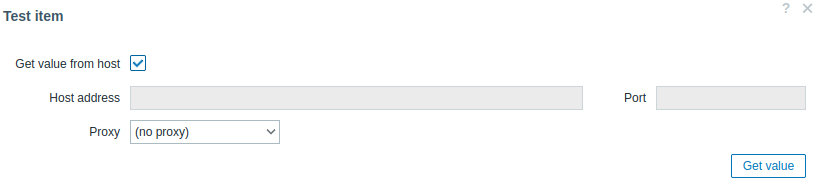
受信した XML を任意の XML フォーマッターにコピーし、目的のメトリックを見つけます。
1 つのメトリックの XML の例:
<PerfCounterInfo xsi:type="PerfCounterInfo">
    <key>6</key>
    <nameInfo>
        <label>Usage in MHz</label>
        <summary>CPU usage in megahertz during the interval</summary>
        <key>usagemhz</key>
    </nameInfo>
    <groupInfo>
        <label>CPU</label>
        <summary>CPU</summary>
        <key>cpu</key>
    </groupInfo>
    <unitInfo>
        <label>MHz</label>
        <summary>Megahertz</summary>
        <key>megaHertz</key>
    </unitInfo>
    <rollupType>average</rollupType>
    <statsType>rate</statsType>
    <level>1</level>
    <perDeviceLevel>3</perDeviceLevel>
</PerfCounterInfo>
XPath を使用して、受信した XML からカウンター パスを抽出します。 上記の例では、XPath は次のようになります:
| フィールド | xPath | 値 |
|---|---|---|
| group | //groupInfo[../key=6]/key | cpu |
| counter | //nameInfo[../key=6]/key | usagemhz |
| rollup | //rollupType[../key=6] | average |
この結果の場合のパフォーマンス カウンター パスは次のとおりです: cpu/usagemhz[average]