Is this not what you were looking for? Switch to the current version or choose one from the drop-down menu.
5 What's new in Zabbix 1.8.1
5.1 Calculated items
Zabbix 1.8.1 adds support for a new item type - calculated items. These allow to reuse data from other items, making all kinds of calculations in the process.
5.2 New and changed items
- added support of system.stat[] under AIX;
- added support of net.if.* under Windows;
- added support of net.if.list on Windows;
- added support of kernel.maxproc[] under Linux 2.6;
- added possibility to exclude some services from the result of Windows key services[].
5.3 Frontend improvements
5.3.1 Single problem handling in maps
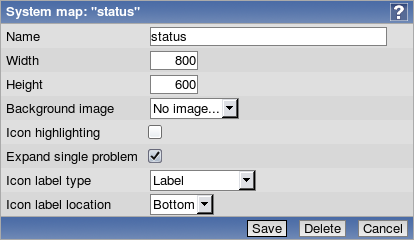
There's now an option for each map, controlling single problem displaying. If it is marked, previous behaviour is used - single problem has trigger name displayed. If it is disabled, single problem is listed as "1 Problem"

And this is the effect it has on maps:
 |
 |
| Expanding of the problem enabled | Expanding of the problem disabled |
5.3.2 Read-only hosts better represented
Hosts that user does not have write permissions to (but has read permissions) are disabled in hostgroup properties and can not be operated by the user. Previously these hosts were not visible at all.

5.3.3 Host status widget in dashboard
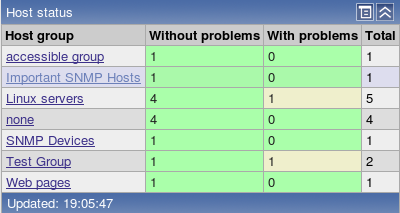
A new widget has been added to dashboard - host status. It shows host groups and how many hosts in each group have at least one problem. For those that have, field is coloured according to the trigger with highest severity.

5.3.4 Changes to Zabbix status reporting
As of version 1.8.1, "Status of Zabbix" dashboard widget and report is only available to users of Zabbix Superadmin type. Additionally, this report/widget shows any PHP installation or configuration problems found.

5.3.5 Item colouring in trigger editing
Trigger editing now colours items according to their status - green for enabled, red for disabled and grey for unsupported. This simple change should make identifying any problems with triggers much easier.

5.3.6 Unacknowledged event filter
New filter option added for Monitoring → Triggers view - "Show triggers with unacknowledged events". This option hides triggers that have all their events acknowledged.
5.3.7 Updated translations
Translations for the following languages have been updated:
- Russian;
- Japanese;
- French.
5.4 Other changes
- Database index fixed, improving node synchronisation a lot. See release notes for upgrade instruction. Fixed index is used by default in new installations.
- API version changed to 1.1.


