Documentation
Table of Contents
- 5 Zabbix 7.0.0の新機能
- AGPL-3.0ライセンス
- ソフトウェア更新チェック
- 非同期ポーラー
- ブラウザ監視
- プロキシ負荷分散と高可用性
- プロキシメモリバッファ
- JITユーザープロビジョニング
- アイテムごとに設定可能なタイムアウト
- Oracle DBが非推奨に
- パッシブエージェントチェック用のJSONプロトコル
- エージェント/エージェント2プロトコルの統合
- アクティブチェックでのフレキシブル/スケジュール間隔のサポート
- 失われたリソースの自動無効化
- スクリプトの手動ユーザー入力
- Zabbix API経由でZabbixサーバーにデータを送信する
- パフォーマンス
- 関数
- アイテム
- 保存前処理
- マクロ
- 定期レポート
- 通知
- データベース
- プロセス
- ディスカバリ
- Connectors
- Templates
- Webインターフェース
- プラグイン
- インストール
5 Zabbix 7.0.0の新機能
このバージョンについては、重大な変更を参照してください。
AGPL-3.0ライセンス
ZabbixはAGPL-3.0ライセンス下で作成され配布されています(以前は、GPL v2.0ライセンスでした)。
ソフトウェア更新チェック
ソフトウェア更新チェックが標準で、新規および既存のインストールに追加されるようになりました。ZabbixフロントエンドはパブリックZabbixエンドポイントと通信して更新をチェックします。
利用可能なZabbixソフトウェアの更新に関するニュースは、[レポート] -> システム情報および(オプションで)システム情報ダッシュボードウィジェットに表示されます。
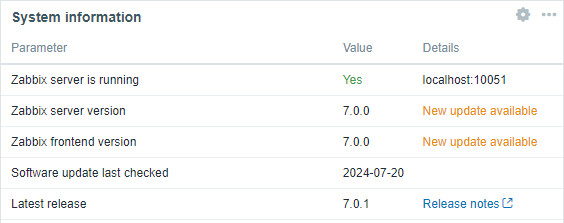
Zabbixサーバーの設定で、AllowSoftwareUpdateCheck=0とすると、ソフトウェア更新チェックを無効にできます。
非同期ポーラー
複数のチェックを同時に実行できる新しいポーラープロセスが追加されました。
agent pollerhttp agent pollersnmp poller(walk[OID]およびget[OID]アイテム用)
これらのポーラーは非同期です。応答を待つことなく新しいチェックを開始でき、同時実行は最大1000の同時チェックまで設定可能です。
非同期ポーラーが開発されたのは、同期ポーラープロセスでは同時に1つのチェックしか実行できず、ほとんどの時間が応答の待機に費やされるためです。 したがって、新しいポーラーはネットワーク応答を待機している間に新しい並列チェックを開始することで効率を高めました。
新しいサーバー/プロキシパラメーターであるStartAgentPollersの値を変更することで、非同期エージェントポーラーを開始できます。 HTTPエージェントポーラーは、それぞれStartHTTPAgentPollersを変更することで開始できます。 SNMPポーラーは、それぞれStartSNMPPollersを変更することで開始できます。
非同期ポーラー (エージェント、HTTPエージェント、およびSNMP)の最大同時実行数は、MaxConcurrentChecksPerPollerによって定義されます。
アップグレード後、すべてのエージェント、HTTPエージェント、およびSNMP walk[OID]チェックが非同期ポーラーに移動されることに注意してください。
開発の一環として、永続的な接続cURL機能がHTTPエージェントチェックに追加されました。
ブラウザ監視
新しいアイテムタイプのブラウザアイテムがZabbixに追加され、ブラウザを使用して複雑なWebサイトやWebアプリケーションを監視できるようになりました。 ブラウザアイテムを使用すると、ユーザー定義のJavaScriptコードを実行して、クリック、テキスト入力、Webページのナビゲーションなどのブラウザ関連のアクションをシミュレートできます。
このアイテムは、HTTP/HTTPS経由でデータを収集し、Selenium ServerまたはプレーンWebDriver (ChromeDriver など)をテストエンドポイントとしてW3C WebDriver標準を部分的に実装します。
ブラウザアイテムのサポートは現在実験段階であることに注意してください。
さらに、この機能により、ブラウザ別Webサイトテンプレートと、設定のエクスポート/インポート、Zabbixサーバー/プロキシ設定ファイル、タイムアウト、およびzabbix_jsコマンドラインユーティリティの新しい要素が追加されます。 詳細については、7.0.0へアップグレード時の注意点を参照してください。
プロキシ負荷分散と高可用性
プロキシ負荷分散は、Zabbixにプロキシグループを導入することで実装されます。プロキシグループは、プロキシ間のホストの自動分散、プロキシ負荷の再分散、高可用性を提供します。プロキシがオフラインになると、そのホストはグループ内の他のプロキシに即座に分散されます。
詳細については、プロキシ負荷分散と高可用性 を参照してください。
プロキシメモリバッファ
Zabbixプロキシ用にメモリバッファが開発されました。メモリバッファを使用すると、新しいデータ (アイテム値、ネットワークディスカバリ、ホスト自動登録)をバッファに保存し、データベースにアクセスせずにZabbixサーバーにアップロードできます。
Zabbix 7.0より前のインストールでは、収集されたデータはZabbixサーバーにアップロードされる前にデータベースに保存されていました。これらのインストールでは、アップグレード後もこれがデフォルトの動作のままです。
パフォーマンスを最適化するには、プロキシでメモリバッファを使用するように設定することをお勧めします。これは、ProxyBufferModeの値を"disk" (既存のインストールではハードコードされたデフォルト)から "hybrid"(推奨) または"memory"に変更することで可能です。メモリバッファサイズ (ProxyMemoryBufferSizeパラメーター)も設定する必要があります。
ハイブリッドモードでは、プロキシが停止した場合、バッファがいっぱいになった場合、またはデータが古すぎる場合に、未送信のデータをデータベースにフラッシュすることで、バッファがデータ損失から保護されます。すべての値がデータベースにフラッシュされると、プロキシはメモリバッファの使用に戻ります。
メモリモードでは、メモリバッファが使用されますが、データ損失に対する保護はありません。プロキシが停止した場合、またはメモリがいっぱいになった場合は、未送信のデータが削除されます。
ハイブリッドモード (ProxyBufferMode=hybrid)は、Zabbix 7.0以降のすべての新規インストールに適用されます。
ProxyMemoryBufferSizeやProxyMemoryBufferAgeなどの追加パラメーターは、それぞれメモリバッファサイズとバッファ内のデータの最大保存期間を定義します。
プロキシメモリバッファを監視するための新しい内部アイテムが追加されました。
JITユーザープロビジョニング
以前は、プロビジョニングされたユーザーは、プロビジョニング中に作成されたメディアのみに制限されており、勤務時間や深刻度などのプロパティを編集する柔軟性はありませんでした。
Zabbixでプロビジョニングされたユーザーには、より多くの柔軟性が提供されます。
- プロビジョニングされたユーザーメディアを無効/有効にできます。
- プロビジョニングされたユーザーのメディアフィールド(有効な時間帯、指定した深刻度のときに使用、有効など)を手動で編集できます。
- プロビジョニングされたユーザーに手動でユーザーメディアを追加できます (たとえば、追加のメールアドレス)。
- 手動で追加されたユーザーメディアを削除できます (プロビジョニングされたユーザーメディアは削除できません)。
さらに、プロビジョニングのユーザーメディアマッピングを構成するときに、有効な時間帯、指定した深刻度のときに使用、有効などのフィールドが使用できるようになりました。ユーザーメディアタイプマッピングフォームへの変更は、プロビジョニング中に作成された新しいメディアに対してのみ有効になることに注意してください。
アイテムごとに設定可能なタイムアウト
アイテムごとのタイムアウト設定が、より多くのアイテムタイプで利用できるようになりました (サポートされているアイテムタイプを参照してください)。 アイテムレベルでタイムアウト値を設定するだけでなく、さまざまなアイテムタイプに対してグローバルおよびプロキシタイムアウトを定義することもできます。
アイテムレベルで設定されたタイムアウトは、最も優先度が高くなります。 デフォルトでは、グローバルタイムアウトがすべてのアイテムに適用されますが、プロキシタイムアウトが設定されている場合は、グローバルタイムアウトが上書きされます。
Oracle DBが非推奨に
バックエンドデータベースとしてのOracleのサポートは非推奨となり、将来のバージョンでは完全に削除される予定です。
パッシブエージェントチェック用のJSONプロトコル
パッシブエージェントチェック用のJSONベースのプロトコルが実装されました。
古いエージェントとの互換性のために、古いプレーンテキストプロトコルへのフェイルオーバーが追加されました。エージェントが"ZBX_NOTSUPPORTED"を返す場合、Zabbixはインターフェースを古いプロトコルとしてキャッシュし、プレーンテキストのアイテムキーのみを送信してチェックを再試行します。
Zabbix getは、新しいオプション-P --protocol <value>で実行できるようになりました。"value"は次のいずれかです。
- auto - JSONプロトコルを使用して接続し、フォールバックしてプレーンテキストプロトコルで再試行します (デフォルト)。
- json - JSONプロトコルキーを使用して接続します。
- plaintext - アイテムキーのみが送信されるプレーンテキストプロトコルを使用して接続します。
アイテムキーがサポートされていない場合、Zabbix getは終了コード1を返します。
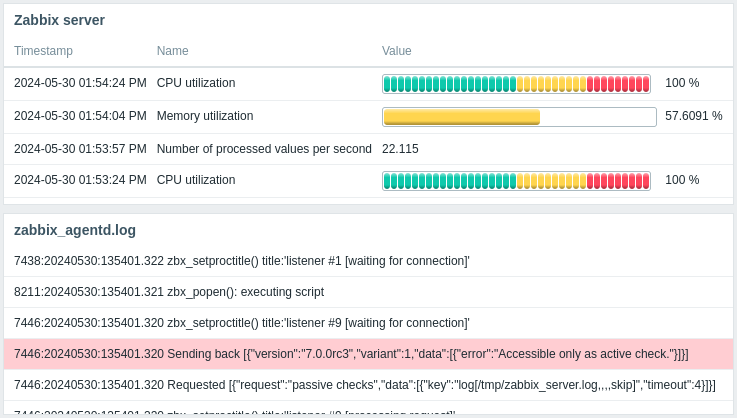
エージェント/エージェント2プロトコルの統合
ZabbixエージェントをZabbixエージェント2プロトコルに切り替えることで、Zabbixエージェントとエージェント2プロトコルが統合されました。ZabbixエージェントとZabbixエージェント2のリクエスト/レスポンスの違いは、"variant"タグ値で表されます("1" - Zabbixエージェント、"2" - Zabbixエージェント2)。
アクティブチェックでのフレキシブル/スケジュール間隔のサポート
アクティブチェックで、フレキシブル/スケジュール間隔がZabbixエージェントとZabbixエージェント2の両方でサポートされるようになりました (以前はZabbixエージェント2のみ)。
失われたリソースの自動無効化
ローレベルディスカバリで検出されなくなったリソースは、自動的に無効化できるようになりました。これらのリソースは、すぐに無効化することも、指定した期間後に無効化することも、無効にしないことも可能です (ディスカバリルール設定の新しいパラメーターDisable lost resourcesを参照してください)。
失われたリソース(ホスト、アイテム、トリガー)は、情報列のアイコンでマークされます。ツールチップテキストに、そのステータスの詳細が表示されます。
同じ開発で、Keep lost resources periodパラメーターの名前がDelete lost resourcesに変更され、すぐに削除する、指定した期間後に削除する、または削除しないオプションが追加されました。

スクリプトの手動ユーザー入力
フロントエンドスクリプトの手動ユーザー入力を使用すると、スクリプトを実行するたびにカスタムパラメーターを指定できます。これにより、パラメーターが1つだけ異なる複数の類似ユーザースクリプトを作成する必要がなくなります。
たとえば、実行中にスクリプトに異なる整数または異なるURLアドレスを指定したい時があります。
手動ユーザー入力を有効にするには:
- 必要な場合はスクリプト(コマンド、スクリプト、スクリプトパラメーター)で{MANUALINPUT}マクロを使用するか、URLスクリプトのURLフィールドで使用します。
- 高度なスクリプト設定で、手動ユーザー入力を有効にし、入力オプションを設定します:

ユーザー入力を有効にすると、スクリプトの実行前に、手動入力ポップアップがユーザーに対して表示され、カスタム値の入力を求められます。入力された値は、スクリプト内の{MANUALINPUT}に置き換えられます。
設定に応じて、ユーザーは文字列値を入力するか、事前に決定されたオプションのドロップダウンから値を選択するように求められます。

Zabbix API経由でZabbixサーバーにデータを送信する
以前は、特定のデータをZabbixサーバーに送信するには、Zabbix senderユーティリティを使用するか、Zabbix senderで使用されるものと同様のカスタムJSONベースの通信プロトコルを実装する必要がありました。
現在は、history.push APIメソッドを使用して、HTTPプロトコル経由でZabbixサーバーにデータを送信することもできます。 送信されたデータを受信するには、構成されたトラッパーアイテムまたはHTTPエージェントアイテム(トラッピングが有効)が必要であることに注意してください。
さらに、正しいhistory.push操作は、追加のフィルタリングオプション(新しいPushアクションと Historyリソース)があるレポート → 監査ログに記録され、 history.push APIメソッドは、ユーザーの役割を構成するときにAPIメソッドの許可/拒否リストでも使用できます。
パフォーマンス
Faster reaction to host maintenance update
Previously maintenances were recalculated every minute causing a possible latency of up to 60 seconds for starting or stopping a maintenance period.
Now maintenances are still recalculated every minute or as soon as the configuration cache is reloaded if there are changes to the time period.
Every second the timer process checks if any maintenances must be started/stopped based on whether there are changes to the timeperiods table after the configuration update. Thus the speed of starting/stopping maintenance periods depends on the configuration update interval (10 seconds by default).
Faster permission checks
Permission checks have been made much faster by introducing several intermediary tables for checking non-privileged user permissions.
These tables keep hashes (SHA-256) of user group sets and host group sets for each user/host respectively. Additionally, there is a permission table storing only the accessible combinations of users and hosts, specified by the hash IDs.
This improvement makes the loading of permission-heavy frontend pages (i.e. hosts, problems) much faster. Note that hashes and permissions are not calculated for Super-admin users.
Faster trigger action execution
Trigger action operation, recovery operation and update operation execution on Zabbix server now occurs immediately (less than 100 milliseconds) after a trigger status change, whereas previously users could experience up to 4 seconds of latency.
The reduction in latency is made possible by implementing interprocess communication (IPC) mechanisms between multiple processes (escalator and escalation initiator, escalator and alerter, preprocessing manager and history syncer).
New widgets
Gauge widget
A Gauge widget has been added to dashboard widgets, allowing to display the value of a single item as a gauge.

For more information, see: Gauge.
Pie chart
A Pie chart widget has been added to dashboard widgets, allowing to display values of selected items as:
- pie chart;
- doughnut chart.
 Pie chart. |
 Doughnut chart. |
For more information, see Pie chart.
As part of this development, a Show aggregation function checkbox has been added to the graph widget configuration (in Legend tab).
Honeycomb
A Honeycomb widget has been added to dashboard widgets, which offers a dynamic and vibrant overview of the monitored network infrastructure and resources, where host groups, such as virtual machines and network devices, along with their respective items, are visually represented as interactive hexagonal cells. For more information, see Honeycomb.

Top triggers
A Top triggers widget has been added to dashboard widgets, which allows viewing the triggers with the highest number of problems.

For more information, see: Top triggers.
Item history and Plain text
The new Item history dashboard widget has replaced the Plain text widget, offering several improvements.
Unlike the Plain Text widget, which only displayed the latest item data in plain text, the Item History widget supports various display options for multiple item types (numeric, character, log, text, and binary). For example, it can show progress bars or indicators, images for binary data types (useful for browser items), and highlight text values (useful for log file monitoring).
For more information, see Item history. For details about the replacement of the Plain text widget, see Upgrade notes for 7.0.0.
Host navigator and Item navigator
Host navigator and Item navigator widgets have been added to dashboard widgets. These widgets display hosts or items, respectively, based on various filtering and grouping options, and allow to control the information displayed in other widgets based on the selected host or item. For more information, see Host navigator and Item navigator.

Communication framework for widgets
Dashboard widgets can now connect and communicate with each other, making widgets and dashboards more dynamic.
For this, the Enable host selection widget parameter has been replaced with the Override host parameter, and multiple widgets now have the Time period parameter. These parameters can be used to configure a single data source to control the data displayed in one or multiple widgets without reconfiguring the widgets. The data source can be either a compatible widget from the same dashboard, the dashboard itself, or the widget itself (for time periods).
The Override host parameter is used to set a data source containing a host for which the widget can display data. The Time period parameter is used to set a data source containing a time period for which the widget can display data.
For more information, see Dashboard widgets.
Time periods for aggregation in item value/top hosts widgets
Time periods now can be configured in the Item value and Top hosts widgets.
It is also now possible to display an aggregated value in the item value widget for the chosen period. The aggregated value can be displayed as:
- minimum
- maximum
- average
- count
- sum
- first
- last
These added features are useful for creating data comparison widgets. For example, in one widget you may display the latest value, while in another the average value for a longer period. Or several widgets can be used for side-bu-side comparison of aggregated values from various periods in the past.
Expanded widget availability on template dashboards
Previously, on a template dashboard, you could create only the following widgets: Clock, Graph (classic), Graph prototype, Plain text, URL.
Now template dashboards support the creation of all widgets.
Extended sorting in Top hosts widget
Now, besides sorting by Item value, it is also possible to set Host name or Text column as the order column in Top hosts widget.
Increased functionality of Host availability widget
Host availability widget now allows displaying the hosts with Zabbix agent (active checks) interface. One more availability status has been added, i.e., Mixed, which corresponds to the situation when at least one interface is unavailable and at least one is either available or unknown. Moreover, the possibility to see only the total of hosts, without breakdown by interfaces, has been introduced.
Variable legend size in Graph widget
The Graph widget now supports configuring a variable number of legend rows determined by the number of configured items.
関数
New functions
New functions have been added for use in trigger expressions and calculated items:
- jsonpath() - returns the JSONPath result;
- xmlxpath() - returns the XML XPath result.
See also: String functions
Aggregate calculations
Several aggregate functions have been updated. Now:
- Aggregate functions count and count_foreach support optional parameters operator and pattern, which can be used to fine-tune item filtering and only count values that match given criteria.
- All foreach functions no longer include unsupported items in the count.
- The function last_foreach, previously configured to ignore the time period argument, accepts it as an optional parameter.
アイテム
Consistent default history storage period
The default period for keeping item history has been made consistent at 31 days in the frontend and in the database. This change affects item, template item and item prototype configuration forms as well as the history storage period override in low-level discovery.
Floating point values trimmed for integer items
Now, if a floating point value is received for an unsigned integer item, the value will be trimmed from the decimal part and saved as an integer. Previously a floating point value would make an integer item unsupported.
Counting of lines in Windows event log
A new eventlog.count item has been added to Zabbix agent/agent 2 on Windows. This item returns an integer value with the count of lines in the Windows event log based on the specified parameters.
Asynchronous single-OID SNMP requests
A new get[OID] SNMP item has been added allowing to query for a single OID value asynchronously.
New items
Internal items have been added to monitor the proxy memory buffer:
zabbix[proxy_buffer,buffer,<mode>]- returns the proxy memory buffer usage statistics;zabbix[proxy_buffer,state,changes]- returns the number of state changes between disk/memory buffer modes since start;zabbix[proxy_buffer,state,current]- returns the current working state where the new data are being stored.
Updated items
The system.sw.packages and system.sw.packages.get agent items are now supported on Gentoo Linux.
The system.hostname item now can return a Fully Qualified Domain Name, if the new fqdn option is specified in the type parameter.
The wmi.get and wmi.getall items used with Zabbix agent 2 now return JSON with boolean values represented as strings (for example, "RealTimeProtectionEnabled": "True" instead of "RealTimeProtectionEnabled": true returned previously) to match the output format of these items on Zabbix agent.
A new options parameter has been added to the icmpping, icmppingloss, and icmppingsec items. This parameter can be used to specify whether redirected responses should be treated as target host up or target host down. See simple checks for more details.
The oracle.ts.discovery Zabbix agent 2 item now returns a new {#CON_NAME} LLD macro with container name.
The oracle.ts.stats Zabbix agent 2 item has a new conname parameter to specify the target container name. The JSON format of the returned data has been updated. When no tablespace, type, or conname is specified in the key parameters, the returned data will include an additional JSON level with the container name, allowing differentiation between containers.
Simple checks
A new options parameter has been added to:
This parameter can be used to specify whether redirected responses should be treated as target host up or target host down. See simple checks for more details.
Logging of duplicate SNMPv3 Engine IDs
Engine IDs in SNMPv3 are used as unique identifiers of the device. Sometimes Engine IDs are the same in several devices because of misconfiguration or factory settings. As SNMP standards require Engine IDs to be unique, items sharing the same Engine ID become unsupported in Zabbix leading to availability issues with these devices.
To help troubleshoot such issues, information about SNMPv3 devices sharing the same Engine ID will now be logged periodically by Zabbix server. Note that duplicate Engine ID detection works in each SNMP poller separately.
Documentation link for each standard item
Each standard item now has a direct link from the frontend to its documentation page. The links are under the question mark icon, when opening the item helper from the item configuration form:

保存前処理
Advanced root-cause handling for unsupported item state
Error handling in case of a failure to retrieve an item value (and thus it becoming unsupported) previously lacked the ability to distinguish the reason or runtime stage where the process failed. All errors had to be handled using one and the same option for error handling - either to discard the value, set a specified value or set a specified error message.
It is now possible to match the error message to a regular expression. If the error matches (or does not match) it is possible to specify how the error case should be processed. For example, a specific error message can be "mapped" to a more general case to be matched for and handled by a further preprocessing step, or some intermittent (e.g., network connectivity) issue can be handled differently to a definite failure to acquire the item value.
Multiple Check for not supported value preprocessing steps can now be added. Note that there can be only one "any error" matching step at the end of the pipeline probing for unsupported state of the item. If present, it is activated if none of the specific checks (mis)matched the according pattern, or a (modified) error message was carried over - i.e., no "Discard value" or "Set value to" override came into effect.

See also: Check for not supported value
Better usability for preprocessing step mass update
The previous design of the item mass update form was not sufficiently clear if the preprocessing step update would add or replace preprocessing steps. In the new design Replace and Remove all radio buttons have been added, making it clear for users what to expect as the result of preprocessing step mass update:

マクロ
User macros supported in item and item prototype names
User macros are now supported in item names and item prototype names.
Note that user macro support was removed from item/item prototype names in Zabbix 6.0. Now it has been restored. It is also now supported to search for item name with the macros resolved, which previously was not supported.
The item name with resolved macros is stored in a separate database table (item_rtname), which is an extension of the items table. For each record in the items table, a corresponding item_rtname record is created (except for item prototypes, discovery rule items and template items). The name with resolved macros is limited to 2048 characters.
The item name with resolved macros is displayed in all frontend locations except the Data collection section.
A new configuration syncer worker server process has been added that is responsible for resolving and synchronizing the user macro values in item names.
Extended support of macro functions
Macro functions are now supported with all types of macros:
Macro functions can be used in all locations supporting the listed macros. This applies unless explicitly stated that only a macro is expected (for example, when configuring host macros or low-level discovery rule filters).
定期レポート
定期レポート は、もはや実験的な機能ではありません。
複数ページのレポート
複数ページのダッシュボードの場合、レポートはダッシュボードのすべてのページとともに出力できるようになりました。各PDFページは1つのダッシュボードのページに対応しています。以前は、この機能は最初のダッシュボードのページのみを出力することに限定されていました。
通知
Remote commands on active agents
Starting with Zabbix agent 7.0, it is now possible to execute remote commands on an agent that is operating in active mode. Once the execution of a remote command is triggered by an action operation or manual script execution, the command will be included in the active checks configuration and executed once the active agent receives it. Note that older active agents will ignore any remote commands included in the active checks configuration. For more information, see Passive and active agent checks.
Tag processing support for internal events
The processing of tags returned by the webhook script is now also supported for internal events.
Also, {EVENT.TAGS.<tag name>}, {EVENT.TAGS}, {EVENT.TAGSJSON}, {EVENT.RECOVERY.TAGS}, {EVENT.RECOVERY.TAGSJSON} macros are now supported for internal event notifications.
These changes allow to use webhooks for updating or closing an external issue/support ticket by internal event recovery notification.
データベース
Auditlog converted to hypertable on TimescaleDB
The auditlog table has been converted to hypertable on TimescaleDB in new installations, to benefit from automatic partitioning on time (7 days by default) and better performance.
To successfully upgrade existing installations, you must rerun the `timescaledb.sql`` script, located in database/postgresql, before starting Zabbix server. Zabbix server will log a warning, if started without running this script first.
See also: TimescaleDB setup.
Separate database table for proxies
Proxy records have been moved out of the hosts table and are now stored in the new proxy table.
Also, operational data of proxies (such as last access, version, compatibility) have been moved out of the host_rtdata table and is now stored in the new proxy_rtdata table.
プロセス
Multithreading
Several changes have been made as part of transitioning to a multithreaded architecture:
- A new configure parameter has been added:
--with-stacksize. This parameter allows to override the default thread stack size used by the system (in kilobytes). - User macro resolving has been moved from the preprocessing manager to preprocessing workers.
Server environment hardening
It is now possible to restrict some Zabbix functions to harden the security of the server environment:
- global script execution on Zabbix server can be disabled by setting EnableGlobalScripts=0 in server configuration. For new installations, global script execution on Zabbix server is disabled by default.
- user HTTP authentication can be disabled by setting
$ALLOW_HTTP_AUTH=falsein the frontend configuration file (zabbix.conf.php).
Option for configuration file validation
The possibility of configuration file validation has been added to the maintenance commands of Zabbix server, proxy, agent, agent 2, and web service. The validation can be done using the -T --test-config option. In case of successful validation, the exit code will be "0"; otherwise, the component will exit with non-zero exit code and a corresponding error message. Warnings (e.g., in case of a deprecated parameter) will not affect successful exit code.
Detecting cURL library features at runtime
Previously cURL library features were detected at build time of Zabbix server, proxy or agent. If cURL features were upgraded, to make use of them the respective Zabbix component had to be recompiled.
Now only a restart is required for upgraded cURL library features to become available in Zabbix. Recompilation is no longer required. This is true for Zabbix server, proxy or agent.
See also the upgrade notes.
Agent 2 buffer size
The default value of the BufferSize configuration parameter for Zabbix agent 2 has been increased from 100 to 1000.
Option for Windows agent service startup type
The option to set the startup type of the Zabbix agent/agent 2 Windows service (-S --startup-type) has been added. This option allows configuring the agent/agent 2 service to start automatically at Windows startup (automatic), after the automatically started services have completed startup (delayed), when started manually by a user or application (manual) or to disable the service entirely (disabled).
Support for the old numeric type dropped
The old style of floating point values, previously deprecated, is no longer supported, as numeric values of extended range are used.
Vault prefix parameter added to configuration files
The configuration files zabbix_server.conf and zabbix_proxy.conf have been supplemented with a new, optional parameter Vault Prefix; zabbix.conf.php has been supplemented with the optional $DB['VAULT_PREFIX'], and setup.php has been updated accordingly.
The vault paths for CyberArk and HashiCorp are therefore no longer hardcoded to allow for vault deployments with non-standard paths.
ディスカバリ
Concurrency in network discovery
Previously each network discovery rule was processed by one discoverer process. Thus all service checks within the rule would be performed sequentially.
In the new version the network discovery process has been reworked to allow concurrency between service checks. A new discovery manager process has been added along with a configurable number of discovery workers (or threads). The discovery manager processes discovery rules and creates a discovery job per each rule with tasks (service checks). The service checks are picked up and performed by the discovery workers. Only those checks that have the same IP and port are scheduled sequentially because some devices may not allow concurrent connections on the same port. A new zabbix[discovery_queue] internal item allows to monitor the number of discovery checks in the queue.
The StartDiscoverers parameter now determines the total number of available discovery workers for discovery. The default number of StartDiscoverers has been upped from 1 to 5, and the range from 0-250 to 0-1000. The discoverer processes from previous Zabbix versions have been dropped.
Additionally, the number of available workers per each rule is now configurable in the frontend. This parameter is optional.
Adding host tags during discovery/autoregistration
Additional operations are now available for discovery and autoregistration events:
- Add host tags
- Remove host tags
Sharing discovered host groups
Low-level discovery rules can now link already discovered and existing host groups to hosts created by the same low-level discovery rules. This affects host groups previously discovered and created by other low-level discovery rules based on the specified group prototypes.
Connectors
Stream selective history data and configure attempt intervals
When streaming item values from Zabbix to external systems, you can now configure which item values the connector should stream based on their type of information (numeric (unsigned), numeric (float), character, etc.).
In addition, to avoid unsuccessful attempts to stream data (for example, if the HTTP endpoint is busy or rate-limited), you can now configure the attempt interval - how long the connector should wait after an unsuccessful attempt to stream data.
Stream data to Apache Kafka
A new tool for streaming data to external systems - the Kafka connector for Zabbix server - is now available. The Kafka connector is a lightweight server written in Go, designed to forward item values and events from a Zabbix server to a Kafka broker.
Templates
Webインターフェース
Multi-factor authentication
Multi-factor authentication (MFA) with Time-Based One-Time Password (TOTP) or Duo Universal Prompt can now be used to sign in to Zabbix, providing an additional layer of security beyond just a username and password.
US time format
Time and date displays in the frontend now conform to the US standard date/time display when the default (en_US) frontend theme is used.
| Before | Now |
|---|---|
 |
 |
Cloning simplified
Previously it was possible to Clone and Full clone hosts, templates and maps.
Now the option Clone has been removed, and the option Full clone has been renamed to Clone while still preserving all of the previous functionality of Full clone.
Icons replaced by fonts
All icons in the frontend have been replaced by fonts.
Modal forms
The form for module details is now opened in a modal (pop-up) window.
Collapsible advanced configuration
The Advanced configuration checkboxes, responsible for displaying advanced configuration options, have been replaced with collapsible blocks (see, for example, Connector configuration, Service configuration, Clock widget configuration, etc.). This improves user experience, as collapsing these blocks and saving the configuration will no longer reset the configured advanced options to their default values.
Improved menu section for top triggers
The menu section for viewing the top triggers is now named Top 100 triggers. The possibility to filter triggers by problem name and tags has been added. Also, the number of detected problems instead of the number of status changes is now displayed for each trigger.
Increased character limit for URL fields
The character limit for all URL fields is now 2048 characters. This now includes: Tile URL for settings related to geographical maps, Frontend URL for configuring miscellaneous frontend parameters, URLs for network maps and network map elements, URL A-C for host inventory fields, and URL for the URL dashboard widget.
Item and preprocessing test result truncation
When testing items or testing preprocessing steps, values retrieved from a host and test results are now truncated to a maximum size of 512KB when sent to the frontend. Note that data larger than 512KB is still processed fully by Zabbix server.
Host dashboards tabs
Host dashboards are now displayed as tabs under the header, replacing the previous dropdown in the upper right corner. This enables users to easily transition between various host dashboards and navigate through monitoring data.
Audit log
In Administration → Audit log, you can now enable/disable audit logging of low-level discovery, network discovery and autoregistration activities performed by the server (System user).
The default period of storing audit log records before those are deleted by the housekeeper has been changed from 365 days to 31 days.
Latest data filter
In Monitoring → Latest data, the subfilter and data are no longer displayed by default if the filter is not set.
If upgrading from previous Zabbix versions, see also: Upgrade notes for 7.0.0.
Minimum required PHP version
The minimum required PHP version has been raised from 7.4.0 to 8.0.0.
Renamed elements
- Some dashboard widget parameters with the label Tags have been renamed for more clarity: Item tags (for Data overview widget), Scenario tags (for Web monitoring widget); Problem tags (for Graph, Problem hosts, Problems, Problems by severity, and Trigger overview widget);
- The action link to editing of the map contents, available from the map list in the Monitoring → Maps section, has been renamed from Constructor to Edit;
- The fields for setting history and trend storage periods in the item and item prototype configuration forms have been renamed;
- In Top hosts widget configuration, the fields Order column and Host count have been renamed Order by and Host limit to better describe their functions.
- In the configuration of the Graph widget, the Number of rows field in the Legend tab has been renamed Max number of rows for clarity.
Miscellaneous
Default value of the BufferSize configuration parameter for Zabbix agent 2 has been increased from 100 to 1000.
プラグイン
Ember+
A new plugin for direct monitoring of Ember+ by Zabbix agent 2 has been added.
For more information, see:
インストール
Separate installation packages for RHEL derivatives
Dedicated installation packages are available for versions 8 and 9 of AlmaLinux, CentOS Stream, Oracle Linux, and Rocky Linux. Earlier, single installation packages were provided for RHEL and RHEL-based distributions. Now separate packages are used for RHEL and each of its above-mentioned derivatives to avoid potential problems with binary incompatibility.
Support for ARM64/AArch64
ARM64/AArch64 installation packages are now available for Debian, RHEL 8, 9 and its derivatives, as well as SLES/OpenSUSE Leap 15.