
10 Zabbixでネットワークスイッチやルーターを監視する
はじめに
このガイドでは、Zabbixを使用してネットワークスイッチやルーターの基本的な監視を開始するために必要な手順を説明します。 ここではCiscoルーターを例にしていますが、手順はSNMP対応のネットワーク機器すべてに適用できます。
このガイドの対象者
このガイドは、ネットワーク機器の基本的な監視をすぐに有効にしたい新しいZabbixユーザーやネットワーク管理者向けに作成されています。 高度なカスタマイズや詳細な設定が必要な場合は、SNMPエージェントページやZabbixマニュアルの設定セクションを参照してください。
前提条件
このガイドを進める前に、以下を確認してください。
- ZabbixサーバーおよびZabbix Webインターフェースがインストールされていること:お使いのオペレーティングシステムの手順に従ってインストールしてください(パッケージからのインストールおよびWebインターフェースのインストールを参照)。
- ローカルネットワークのメトリクスを監視する場合は、Zabbixエージェントがインストールされていること。
- SNMP対応デバイス:SNMPが有効なネットワークスイッチまたはルーター(例:Ciscoルーター)。
- MIBファイルがインストールされていること:MIBファイルをインストールすると、Zabbixは数値のOIDを人間が読める名前や説明に変換できます。 適切なMIBサポートがない場合、数値のみが表示され、アイテムの設定やトラブルシューティングが困難になります。
UbuntuでMIBファイルをインストールするには:
1. MIBダウンローダーパッケージをインストールします。
sudo apt-get update
sudo apt-get install snmp-mibs-downloader
ベンダー固有のMIB(例:Cisco、Juniper)を追加する必要がある場合は、適切なMIBディレクトリに配置してください。
- Linuxベースのシステムでは、一般的に /usr/share/snmp/mibs/ または /usr/local/share/snmp/mibs/ などが使用されます。
- Zabbixインストールの場合、MIBファイルは /var/lib/zabbix/mibs/ に保存できます。
MIBDIRS環境変数またはsnmp.confファイルに正しいパスが含まれていることを確認してください。
新しいMIBをシステムが認識しているか確認するには、次のコマンドを使用します。
snmptranslate -IR -On <MIB-NAME>::<object>詳細な手順については、お使いのSNMPライブラリのドキュメントを参照してください。
2. /etc/snmp/snmp.conf を編集し、mibs :で始まる行をコメントアウトして、システムがすべての利用可能なMIBを読み込めるようにします。
3. snmpwalk(例:snmpwalk -v 2c -c <your_community_string> <device_IP>)を実行し、OIDが説明付きの名前で表示されることを確認します。
ご利用の環境によっては、このガイドの一部の手順が若干異なる場合があります。 このガイドは、Ubuntu上で稼働し、Cisco Catalyst 3750V2-24FSネットワーク機器を監視している環境を前提としています。
ネットワーク機器がすでに物理的に設置され、接続されていることを前提としています。
ネットワークデバイスの設定(Ciscoルーターの例)
SNMP経由で監視するには、ネットワークデバイスを設定してSNMPクエリを許可する必要があります。 以下の例はSNMPv2用であり、既存の設定は考慮されていません。 注意:これらのコマンドを適用すると、現在のSNMP設定が上書きされる場合があります。
Ciscoルーターの場合、設定は通常以下の手順で行います。
SNMPv2の例
1. SNMPを有効にし、コミュニティ文字列を設定します。
Ciscoルーターのコンソールにログインし、設定モードに入ります。
configure terminal次に、読み取り専用のコミュニティ文字列を指定してSNMPを有効にします。 例:
snmp-server community <your_community_string> RO<your_community_string> を安全なコミュニティ文字列に置き換えてください。
注:RO(読み取り専用)オプションは、SNMPがデバイスからデータを取得できるようにしますが、設定の変更はできません。
セキュリティ上の理由から、必要なデバイスのみにSNMPアクセスを制限することを推奨します。 アクセスコントロールリスト(ACL)の設定に関する詳細は、Ciscoの公式ドキュメントを参照してください。
2. 設定を保存します。
SNMP設定が再起動後も保持されるように、変更を保存します。
write memorySNMPv3の例
SNMPv3は認証と暗号化による強化されたセキュリティを提供します。 その設定はSNMPv2よりも安全であり、デバイス固有のドキュメントで確認する必要があります。
1. SNMPグループの作成
プライバシー(暗号化)を有効にしたSNMPv3グループを設定します。
configure terminal
snmp-server group <your_group> v3 priv
2. SNMPユーザーの作成
認証とプライバシーを持つSNMPv3ユーザーを追加します。 プレースホルダーを希望の値に置き換えてください。
snmp-server user <your_user> <your_group> v3 auth md5 <auth_password> priv aes 128 <priv_password>3. 設定の保存
write memory詳細やモデル固有の手順については、外部のCisco SNMP設定チュートリアルを参照してください。 このガイドでは、SNMP監視を有効にするための基本的な手順を提供しています。
Zabbixフロントエンドの設定
Zabbix Webインターフェースでホストを作成する
1. Zabbix Webインターフェースにログインします。
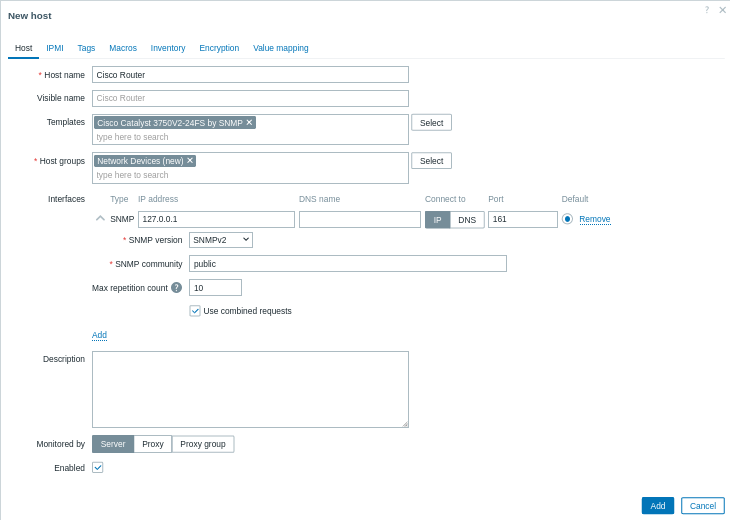
2. 新しいホストを追加します。
データ収集 > ホスト に移動し、ホストの作成 をクリックします。
- ホスト名: デバイスの名前を入力します(例: "Cisco Router")。
- ホストグループ: 既存のグループを選択するか、"Network Devices" のような新しいグループを作成します。
- インターフェース:
- インターフェースの下にある 追加 をクリックします。
- インターフェースタイプとして SNMP を選択します。
- Cisco ルーターの IP アドレスまたは DNS 名を入力します。
- デフォルトの SNMP ポートを設定します(通常は 161)。
- ドロップダウンメニューから適切な SNMP バージョンを選択します(例: SNMPv2)。
- SNMPv1/v2 の場合は、SNMP community フィールドに community string を入力します。 SNMPv3 の場合は、追加の認証情報(Context name、Security name、Security level など)の入力が求められます。
3. テンプレートをリンクする
Templates フィールドで、デバイスに最も適した SNMP テンプレートを選択します。 Zabbix には、多くのデバイスファミリ向けにあらかじめ用意された SNMP templates が多数あります。 たとえば Cisco デバイスを監視する場合は、デバイスの OS またはモデルに対応するテンプレート(Cisco IOS SNMP や Cisco Catalyst 3750<device model> SNMP など)を選択します。
4. 追加 をクリックしてホストを保存します。

収集されたメトリクスを表示する
おめでとうございます。Zabbix でネットワークデバイスの監視が設定されました。
最新データ:
- Zabbix Webインターフェースで、Monitoring > Latest data に移動します。
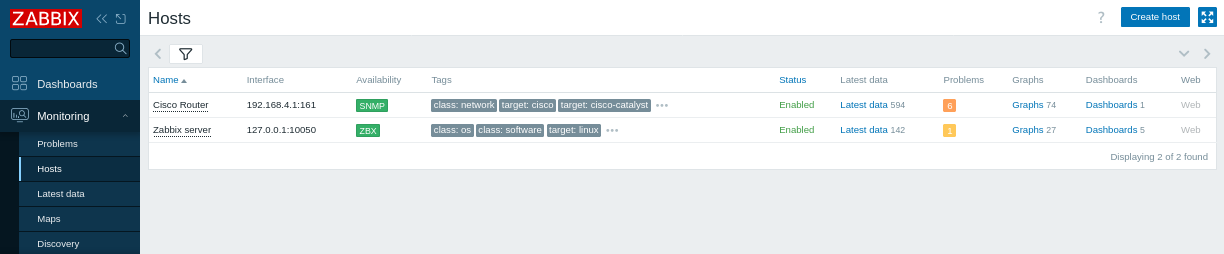
- "Cisco Router" ホスト(または検出されたホスト)を選択して、ハードウェアおよびネットワークの稼働時間、ICMP ロス、ping、応答時間などのメトリクスを表示します。
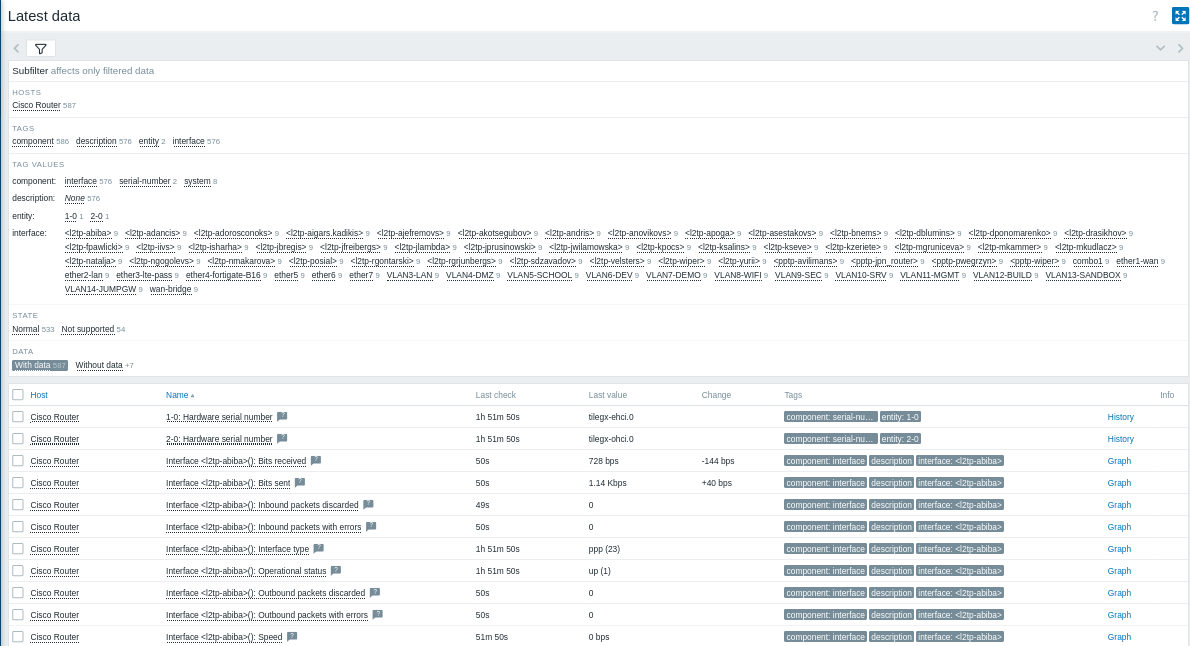
- グラフと画面:
パフォーマンスデータを可視化するには、SNMP アイテムの横にある Graphs をクリックして詳細なメトリクスを表示します。
次の手順として、以下を実行できます。
- カスタム SNMP アイテムを追加する ことで、追加のメトリクスを監視します。
- 問題アラートを設定する ことで、潜在的な問題に関する通知を受け取ります。
SNMPアイテムの作成
ホストの設定が完了したら、特定のメトリクスを監視するためのアイテムを作成できます。
注: テンプレートを使用している場合、この手順は省略できます。テンプレートには既定のアイテムセットがすでに含まれているためです。
1. SNMP OID を特定します:
snmpwalk コマンドを使用して、デバイスで利用可能な OID の一覧を取得します。
例:
snmpwalk -v 2c -c <your_community_string> <device_IP> .監視したいメトリクスの OID を見つけます(たとえば、ポート 3 の受信トラフィックであれば IF-MIB::ifHCInOctets.3)。
数値形式の OID を取得するには、次を使用できます:
snmpget -v 2c -c <your_community_string> -On <device_IP> IF-MIB::ifHCInOctets.32. SNMPアイテムを作成します:
- データ収集 > ホスト に移動し、SNMP ホストの アイテム タブをクリックして、アイテムの作成 をクリックします。
- 名前: 説明的な名前を入力します(例: "Port 3 Incoming Traffic")。
- タイプ: SNMP エージェント を選択します。
- キー: 意味のあるキーを指定します(例:
cisco.ifHCInOctets.3)。 - ホストインターフェース: SNMP インターフェースが選択されていることを確認します。
- SNMP OID: サポートされている形式のいずれかを使用して OID を入力します。例:
get[1.3.6.1.2.1.31.1.1.1.6.3]は単一の値を取得します。walk[1.3.6.1.2.1.31.1.1.1.6.3]は値のサブツリーを非同期で取得します。
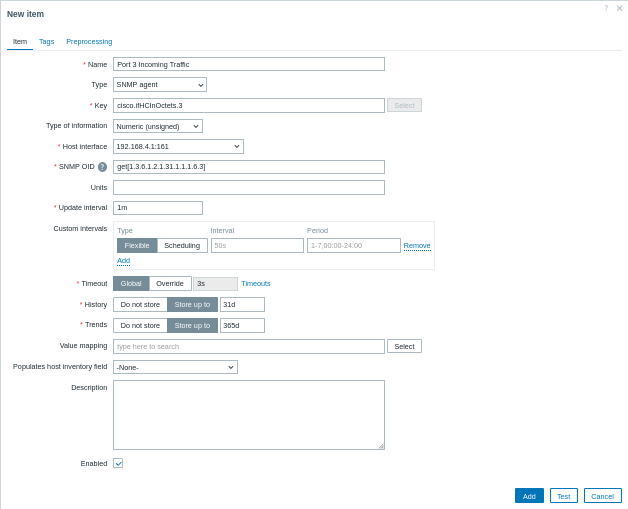
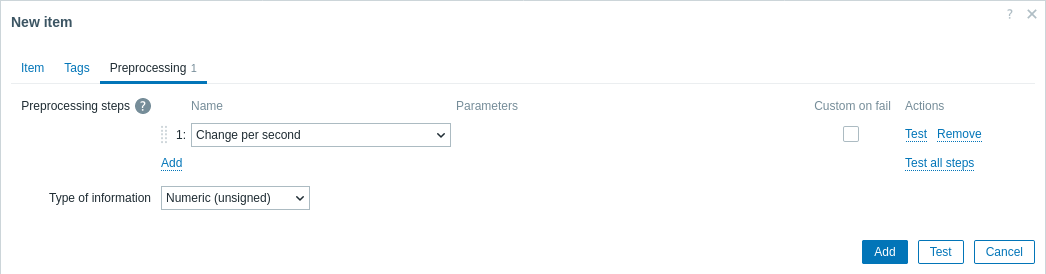
- 前処理(必要な場合): アイテムが累積カウンター(インターフェーストラフィックなど)を返す場合は、前処理 タブに移動し、レートを計算するために "Change per second" のような前処理ステップを追加します。
1 回の SNMP トランザクションで複数の値を取得するには、walk[OID1,OID2,...] という構文で複数の OID を指定できます。
数値OIDとMIB名の相互変換
SNMPを使用する際、数値OIDと対応するMIB名を相互に変換する必要がある場合があります。 この変換により、メトリクスの特定やトラブルシューティングが容易になります。
- MIB名を数値OIDに変換するには、
snmptranslateコマンドに-Onオプションを付けて使用します。 たとえば、MIB名IF-MIB::ifHCInOctets.3を数値OIDに変換するには、次のように実行します。
snmptranslate -On IF-MIB::ifHCInOctets.3このコマンドの出力例:
.1.3.6.1.2.1.31.1.1.1.6.3- 数値OIDをMIB名に変換するには、
snmptranslateコマンドに-IR(または-m ALL)オプションを付けて逆変換します。 たとえば、数値OID.1.3.6.1.2.1.31.1.1.1.6.3をMIB名に変換するには、次のように実行します。
snmptranslate -IR -On .1.3.6.1.2.1.31.1.1.1.6.3このコマンドの出力例:
IF-MIB::ifHCInOctets.3障害アラートの設定
このガイドでは、メールアラートを送信するための基本的な設定手順を説明します。
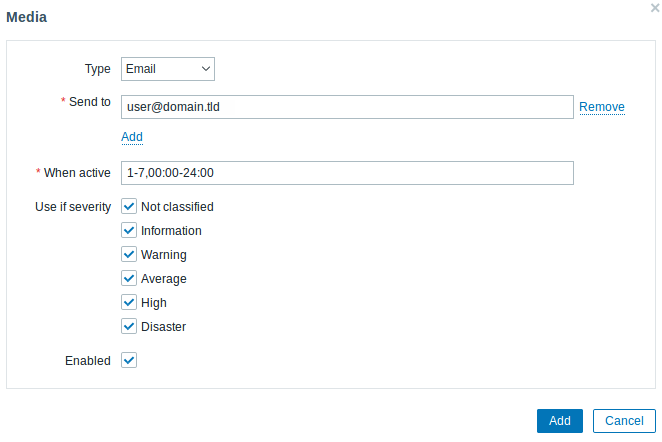
1. ユーザー設定 > プロファイルに移動し、メディアタブに切り替えてメールアドレスを追加します。
2. 障害通知の受信のガイドに従います。
次回、Zabbixが障害を検出したときに、メールでアラートを受信できるはずです。
設定をテストする
Zabbixがネットワークパフォーマンスの問題を正しく検出できることを確認するために、ICMP ping応答時間のしきい値を上げて実際の問題をシミュレートします。
1. Zabbixで「Cisco Router」ホストの設定を開きます。
2. マクロタブに移動し、継承されたホストマクロを選択します。
3. {$ICMP_RESPONSE_TIME_WARN}マクロ(または同様の応答時間しきい値マクロ)を探します。
4. 非常に低い値(例:0.001)を設定し、ping応答がこの値を超えた場合にアラートが発生するようにします。
5. 更新をクリックして変更を適用します。
6. Zabbixがシミュレートされた問題を検出するまでしばらく待ちます。
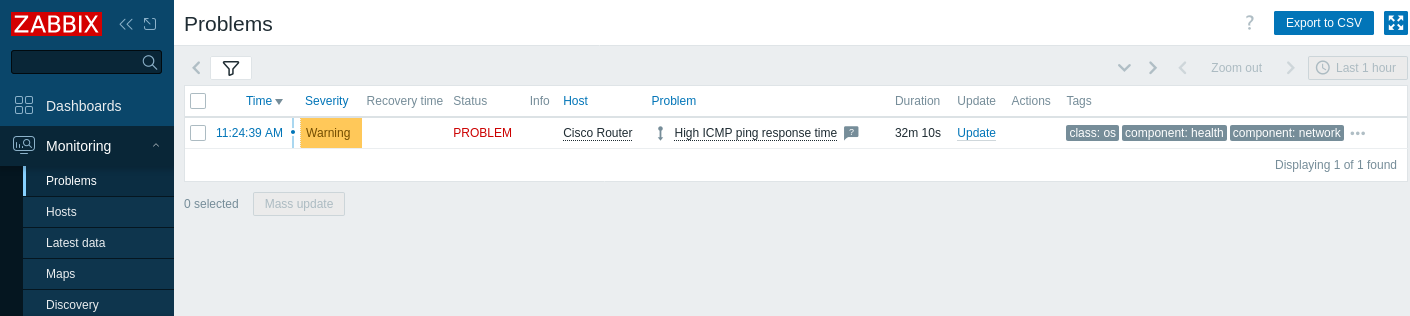
7. 監視 > 障害に移動し、アラートが表示されることを確認します(例:「ICMP ping応答時間が高い」)。
アラートが設定されている場合は、問題アラートも受信するはずです。
8. マクロ値を元の設定に戻し、更新をクリックして変更を保存します。
9. 問題が解決され、障害セクションから消えることを確認します。
SNMP監視のトラブルシューティング
ZabbixのWebインターフェースでSNMPアイコンが赤色で表示される、またはデータが収集されない場合は、以下の手順をお試しください。
1. SNMP接続を確認します。
SNMPv2の場合は、Zabbixサーバーから次のコマンドを実行します。
snmpwalk -v 2c -c <community_string> <device_IP> .このコマンドは、デバイスがSNMPクエリに応答することを確認します。
SNMPv3の場合は、適切なSNMPv3認証情報を含めます。
snmpwalk -v3 -u <your_user> -l authPriv -a MD5 -A <auth_password> -x AES -X <priv_password> <device_IP> .これにより、SNMPv3認証情報が正しく、デバイスが安全に応答していることを確認できます。
2. 前提条件で説明されているとおりに、MIBファイルがインストールされ、有効になっていることを確認します。
これを確認するには、ネットワークデバイスを問い合わせた際に、次のコマンドでエラーが出ない必要があります。
snmpwalk -v 2c -c <your_community_string> <device_IP> ifInOctetsこれにより、エラーなしで変換済みのOIDが返されるはずです。
3. Zabbixで設定されているSNMPバージョンと認証情報が、デバイスに設定されているものと一致していることを確認します。
たとえば、Zabbixのホスト設定にあるSNMP設定を確認し、デバイスの設定と照合してください。
Ciscoデバイスでは、次のコマンドを実行してSNMP設定を確認できます。
show running-config | include snmpこれにより、コミュニティ文字列(SNMPv2の場合)またはSNMPv3ユーザーの詳細が正しいことを確認できます。
4. ネットワークデバイスでSNMPが正しく有効になっていることを確認します。
Ciscoルーターでは、コンソールにログインして次を実行します。
show running-config | include snmpこのコマンドは有効なSNMP設定を表示し、SNMPが適切に設定されていることの確認に役立ちます。
5. Zabbixサーバーとデバイスの間で、ファイアウォールやネットワーク上の問題によってSNMPトラフィック(通常はポート161)がブロックされていないことを確認します。
次のコマンドで接続性をテストできます。
nc -zv <device_IP> 161
nc -zv は、デバイス上でポート161が開いており、待ち受け状態であるかを確認します。
さらに、UbuntuでUFWを使用している場合は、ファイアウォールの状態を確認します。
sudo ufw statusまたは、iptablesの場合は次を実行します。
sudo iptables -L -n6. 問題の特定に役立てるため、SNMP関連のエラーがないかZabbixサーバーのログファイルを確認します。
tail -f /tmp/zabbix_server.logtail -f を使用すると、ログの更新をリアルタイムで監視できます。
関連情報:
- アイテムの作成 - 追加のメトリクスを追加する方法について説明します。
- SNMPエージェント - ZabbixによるSNMP監視に関する追加情報。
- ネットワークデバイス用の標準化テンプレート - 利用可能なSNMPテンプレートに関する情報。
- SNMP OIDのディスカバリ - スイッチでのSNMPディスカバリに関する追加情報。
- ネットワークディスカバリルールの設定 - Zabbixがホストやサービスを検出するために使用するネットワークディスカバリルールの設定方法に関する追加情報。