On this page
27 System information
Overview
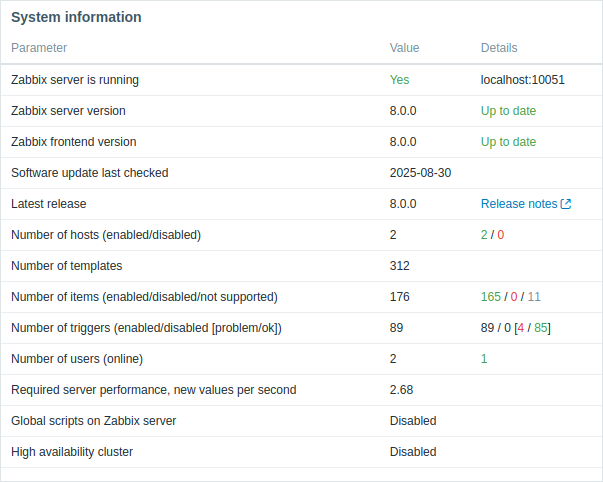
The System information widget displays a summary of key Zabbix server and system data or details of high availability nodes.

It displays the same data as Reports > System information.
Configuration
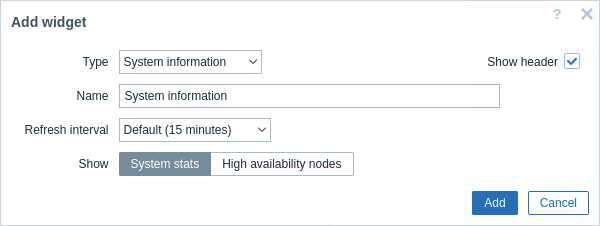
To configure, select System information as type:

In addition to the parameters that are common for all widgets, you may set the following specific options:
| Show | Select what to display: System stats - display a summary of key Zabbix server and system data; High availability nodes - display the status of high availability nodes (if high availability cluster is enabled). |
| Show software update check details | Mark the checkbox to display Zabbix software update check details. This option is only available if software update check is enabled in Zabbix server configuration and "System stats" is selected in the Show field. |

