Join our translation project and help translate Zabbix documentation into your native language.
4 Monitor MySQL with Zabbix agent 2
Introduction
This page walks you through the steps required to start basic monitoring of a MySQL server.
To monitor a MySQL server, there are several approaches: Zabbix agent, Zabbix agent 2, or the Open Database Connectivity (ODBC) standard. The primary focus of this guide is on monitoring a MySQL server with Zabbix agent 2, which is the recommended approach due to its seamless configuration across various setups. However, this page also offers instructions for the other approaches, so feel free to choose the one that best suits your requirements.
Who this guide is for
This guide is designed for new Zabbix users and contains the minimum set of steps required to enable basic monitoring of a MySQL server. If you are looking for deep customization options or require more advanced configuration, see the Configuration section of Zabbix manual.
Prerequisites
Before proceeding with this guide, you need to download and install Zabbix server, Zabbix frontend and Zabbix agent 2 according to the instructions for your OS.
Based on your setup, some of the steps in this guide may slightly differ. This guide is based on the following setup:
- Zabbix version: Zabbix 7.2 PRE-RELEASE (installed from packages)
- OS distribution: Ubuntu
- OS version: 22.04 (Jammy)
- Zabbix components: Server, Frontend, Agent 2
- Database: MySQL
- Web server: Apache
Create MySQL user
To monitor a MySQL server, Zabbix requires access to it and its processes. Your MySQL installation already has a user with the required level of access (the user "zabbix" that was created when installing Zabbix), however, this user has more privileges than necessary for simple monitoring (privileges to DROP databases, DELETE entries from tables, etc.). Therefore, a MySQL user for the purpose of only monitoring the MySQL server needs to be created.
1. Connect to the MySQL client, create a "zbx_monitor" user (replace <password> for the "zbx_monitor" user with a password of your choice), and GRANT the necessary privileges to the user:
mysql -u root -p
       # Enter password:

       mysql> CREATE USER 'zbx_monitor'@'%' IDENTIFIED BY '<password>';
       mysql> GRANT REPLICATION CLIENT,PROCESS,SHOW DATABASES,SHOW VIEW ON *.* TO 'zbx_monitor'@'%';
       mysql> quit;
Once the user is created, you can move on to the next step.
Configure Zabbix frontend
1. Log into Zabbix frontend.
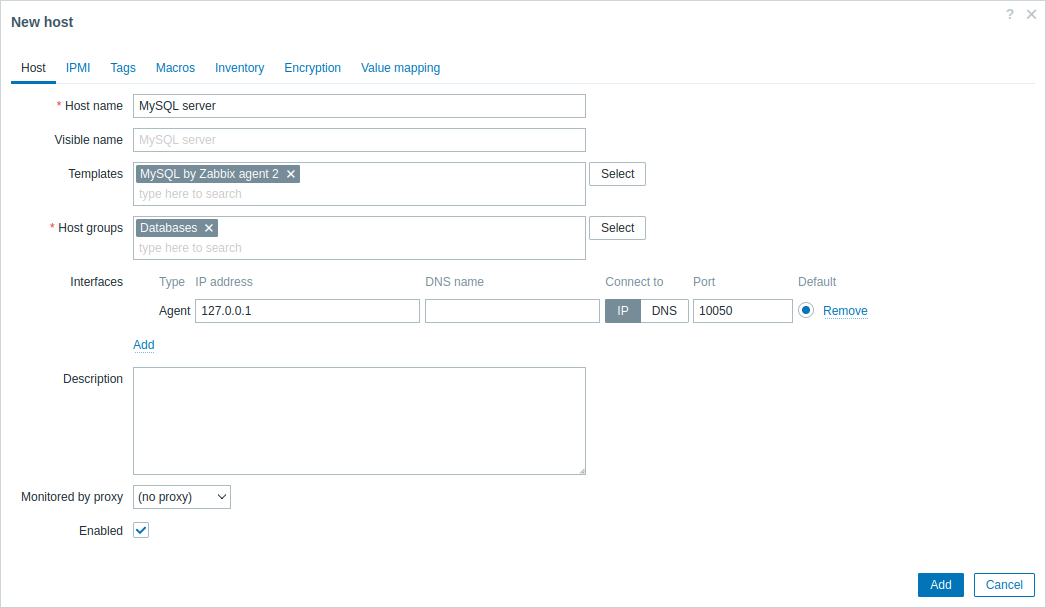
2. Create a host in Zabbix web interface:
- In the Host name field, enter a host name (e.g., "MySQL server").
- In the Templates field, type or select the template "MySQL by Zabbix agent 2" that will be linked to the host.
- In the Host groups field, type or select a host group (e.g., "Databases").
- In the Interfaces field, add an interface of type "Agent" and specify your MySQL server IP address. This guide uses "127.0.0.1" (localhost) for monitoring a MySQL server that is installed on the same machine as Zabbix server and Zabbix agent 2.
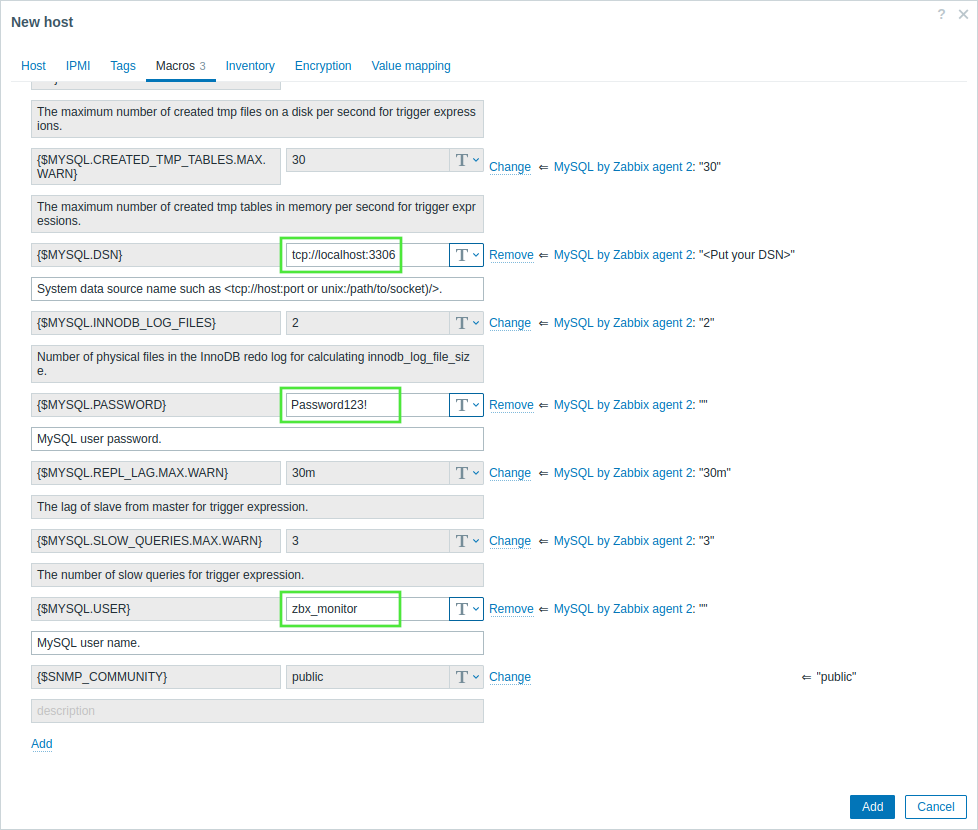
- In the Macros tab, switch to Inherited and host macros, look for the following macros and click on Change next to the macro value to update it:
- {$MYSQL.DSN} - set the data source of the MySQL server (the connection string of a named session from the MySQL Zabbix agent 2 plugin configuration file). This guide uses the default data source "tcp://localhost:3306" for monitoring a MySQL server that is installed on the same machine as Zabbix server and Zabbix agent 2.
- {$MYSQL.PASSWORD} - set the password of the previously created MySQL user "zbx_monitor".
- {$MYSQL.USER} - set the name of the previously created MySQL user "zbx_monitor".
3. Click on Add to add the host. This host will represent your MySQL server.
View collected metrics
Congratulations! At this point, Zabbix is already monitoring your MySQL server.
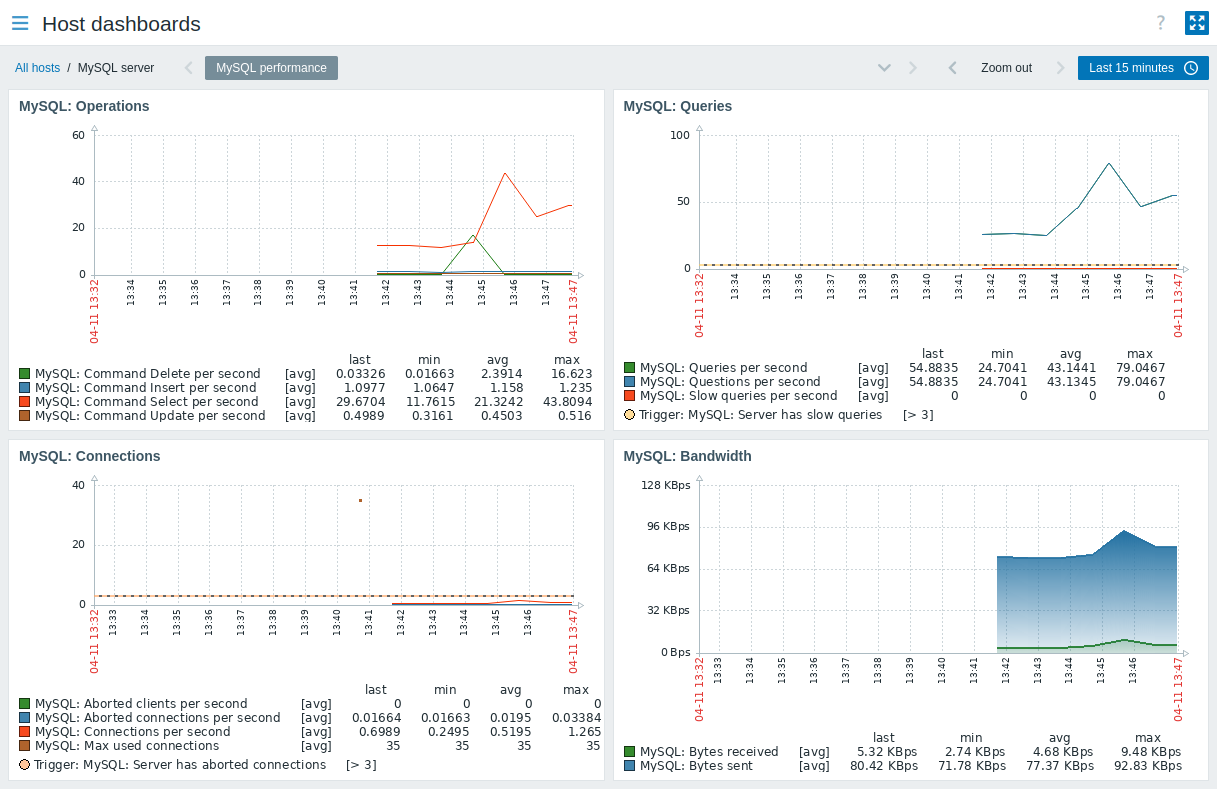
To view collected metrics, navigate to the Monitoring → Hosts menu section and click on Dashboards next to the host.

This action will take you to the host dashboard (configured on the template level) with the most important metrics collected from the MySQL server.
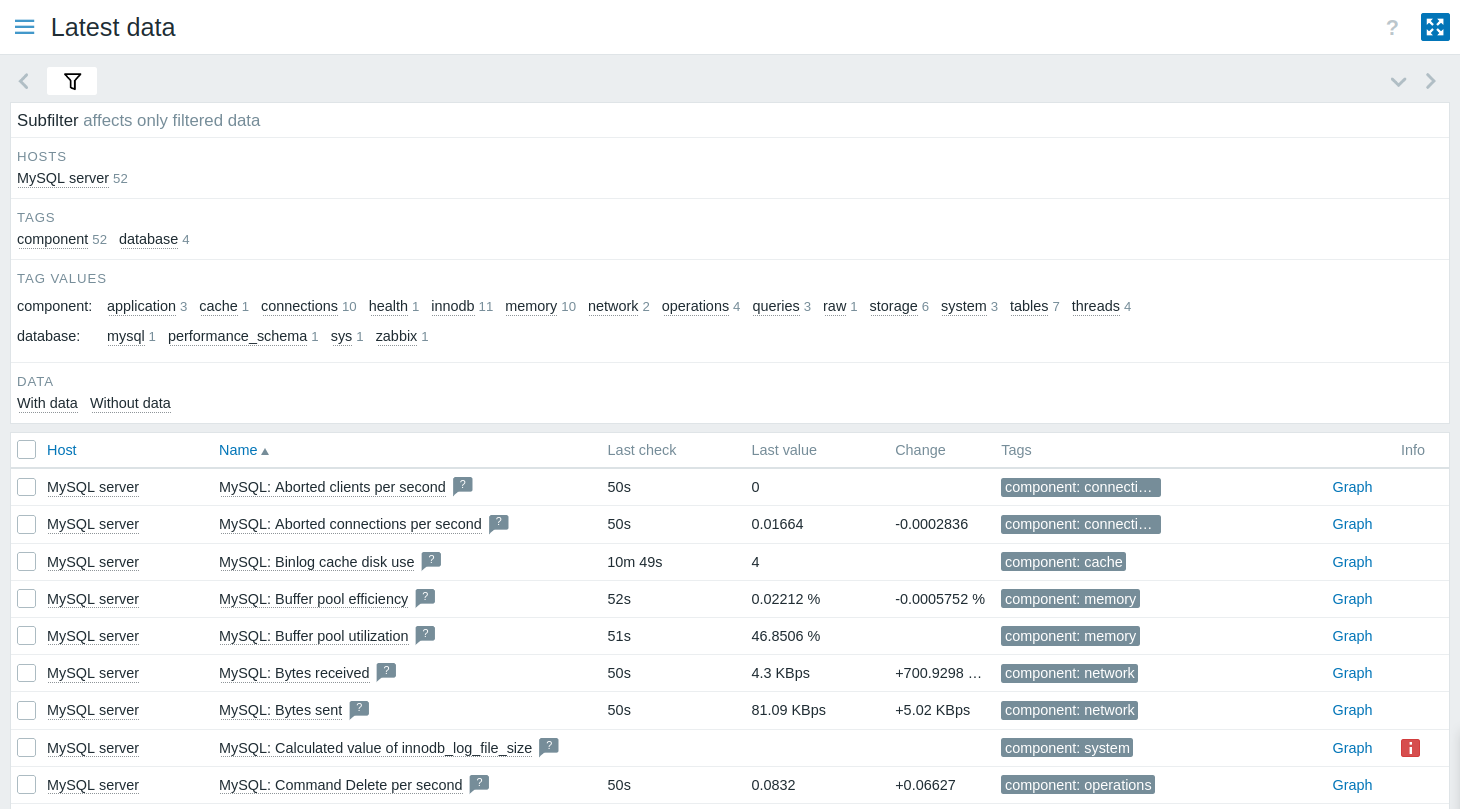
Alternatively, from the Monitoring → Hosts menu section, you can click on Latest data to view all the latest collected metrics in a list. Note that the item MySQL: Calculated value of innodb_log_file_size is expected to have no data, as the value will be calculated from data in the last hour.
Set up problem alerts
Zabbix can notify you about a problem with your infrastructure using a variety of methods. This guide provides basic configuration steps for sending email alerts.
1. Navigate to User settings → Profile, switch to the Media tab and add your email.
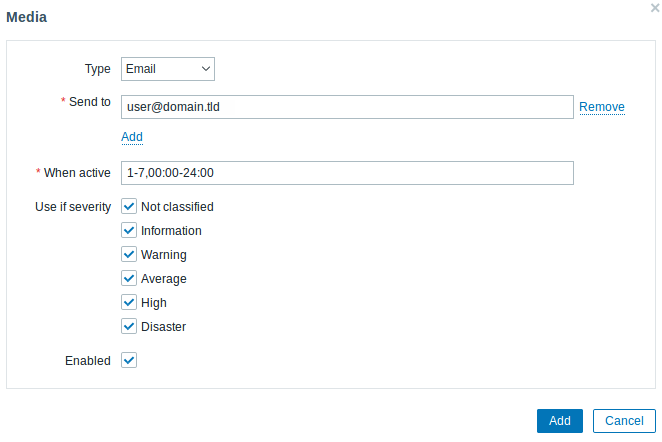
2. Follow the guide for Receiving a problem notification.
Next time, when Zabbix detects a problem, you should receive an alert via email.
Test your configuration
To test your configuration, we can simulate a real problem by updating the host configuration in Zabbix frontend.
1. Open your MySQL server host configuration in Zabbix.
2. Switch to the Macros tab and select Inherited and host macros.
3. Click on Change next to, for example, the previously configured {$MYSQL.USER} macro value and set a different MySQL user name.
4. Click on Update to update the host configuration.
5. In a few moments, Zabbix will detect the problem "MySQL: Service is down", because it will not be able to connect to the MySQL server. The problem will appear in Monitoring → Problems.

If alerts are configured, you will also receive the problem notification.
6. Change the macro value back to its previous value to resolve the problem and continue monitoring the MySQL server.
Other approaches to monitor MySQL
Instead of monitoring a MySQL server with Zabbix agent 2, you could also use Zabbix agent or the Open Database Connectivity (ODBC) standard. While using Zabbix agent 2 is recommended, there might be some setups that do not support Zabbix agent 2 or require a custom approach.
The key difference between Zabbix agent and ODBC lies in the data collection method - Zabbix agent is installed directly on the MySQL server and collects data using its built-in functionality, while ODBC relies on an ODBC driver to establish a connection to the MySQL server and retrieve data using SQL queries.
Although many of the configuration steps are similar to monitoring a MySQL server with Zabbix agent 2, there are some significant differences - you need to configure Zabbix agent or ODBC to be able to monitor a MySQL server. The following instructions walk you through these differences.
Monitor MySQL with Zabbix agent
To monitor a MySQL server with Zabbix agent, you need to download and install Zabbix server, Zabbix frontend and Zabbix agent according to the instructions for your OS.
Once you have successfully installed the required Zabbix components, you need to create a MySQL user as described in the Create MySQL user section.
After you have created the MySQL user, you need to configure Zabbix agent to be able to establish a connection with the MySQL server and monitor it. This includes configuring multiple user parameters for executing custom agent checks, as well as providing Zabbix agent with the necessary credentials for connecting to the MySQL server as the previously created "zbx_monitor" user.
Configure Zabbix agent
1. Navigate to the Zabbix agent additional configurations directory.
The Zabbix agent additional configurations directory should be located in the same directory as your Zabbix agent configuration file (zabbix_agentd.conf). Depending on your OS and Zabbix installation, this directory can have a different location than specified in this guide. For default locations, check the Include parameter in the Zabbix agent configuration file.
Instead of defining all of the necessary user parameters for monitoring the MySQL server in the Zabbix agent configuration file, these parameters will be defined in a separate file in the additional configurations directory.
2. Create a template_db_mysql.conf file in the Zabbix agent additional configurations directory.
3. Copy the contents from the template_db_mysql.conf file (located in the Zabbix repository) to the template_db_mysql.conf file you created, and save.
4. Restart Zabbix agent to update its configuration.
Once you have configured Zabbix agent user parameters, you can move on to configure the credentials that will allow Zabbix agent to access the MySQL server.
5. Navigate to the Zabbix agent home directory (if it does not exist on your system, you need to create it; default: /var/lib/zabbix).
6. Create a .my.cnf file in the Zabbix agent home directory.
7. Copy the following contents to the .my.cnf file (replace <password> with the password of the "zbx_monitor" user).
Configure Zabbix frontend and test your configuration
To configure Zabbix frontend, follow the instructions in the Configure Zabbix frontend section with the following adjustments:
- In the Templates field, type or select the template "MySQL by Zabbix agent" that will be linked to the host.
- Configuring Macros is not required.
Once you have configured Zabbix frontend, you can view collected metrics and set up problem alerts.
To test your configuration, follow the instructions in the Test your configuration section with the following adjustments:
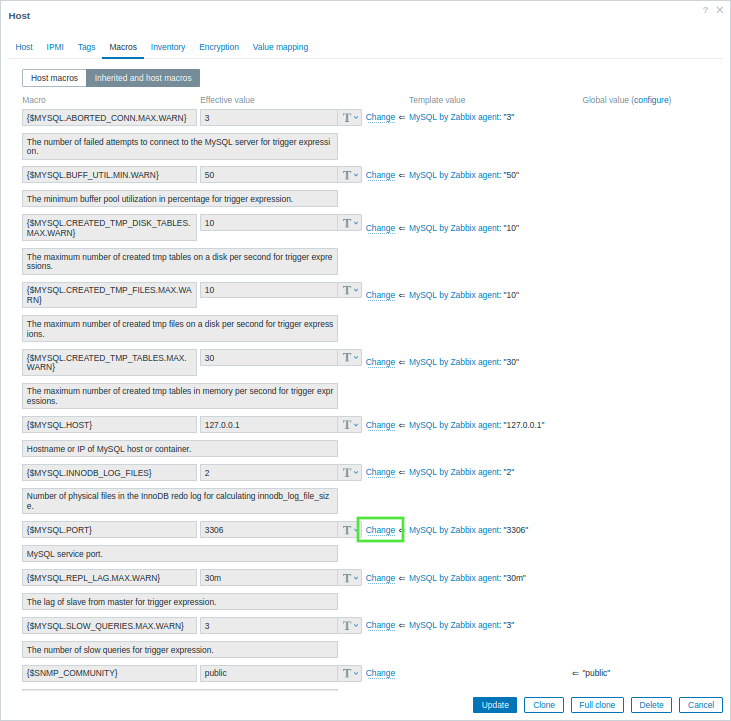
- In the Inherited and host macros section of the MySQL server host configuration, click on Change next to the {$MYSQL.PORT} macro value and set a different port (e.g., "6033").
Monitor MySQL with ODBC
To monitor a MySQL server with ODBC, you need to download and install Zabbix server and Zabbix frontend.
Once you have successfully installed the required Zabbix components, you need to create a MySQL user as described in the Create MySQL user section.
After you have created the MySQL user, you need to setup ODBC. This includes installing one of the most commonly used open source ODBC API implementations - unixODBC - and a unixODBC driver, as well as editing the ODBC driver configuration file.
Configure ODBC
1. Install unixODBC. The suggested way of installing unixODBC is to use the Linux operating system default package repositories.
2. Install the MariaDB unixODBC database driver. Although you have a MySQL database, the MariaDB unixODBC driver is used for compatibility issues.
3. Check the location of the ODBC configuration files odbcinst.ini and odbc.ini.
The result of executing this command should be similar to the following.
unixODBC 2.3.9
       DRIVERS............: /etc/odbcinst.ini
       SYSTEM DATA SOURCES: /etc/odbc.ini
       FILE DATA SOURCES..: /etc/ODBCDataSources
       ...
4. To configure the ODBC driver for monitoring a MySQL database, you need the driver name, which is located in the odbcinst.ini file. In the following odbcinst.ini file example, the driver name is "MariaDB Unicode".
[MariaDB Unicode]
       Driver=libmaodbc.so
       Description=MariaDB Connector/ODBC(Unicode)
       Threading=0
       UsageCount=1
5. Copy the following contents to the odbc.ini file (replace <password> with the password of the "zbx_monitor" user). This guide uses "127.0.0.1" (localhost) as the MySQL server address for monitoring a MySQL server that is installed on the same machine as the ODBC driver. Note the data source name (DSN) "test", which will be required when configure Zabbix frontend.
[test]
       Driver=MariaDB Unicode
       Server=127.0.0.1
       User=zbx_monitor
       Password=<password>
       Port=3306
       Database=zabbix
Configure Zabbix frontend and test your configuration
To configure Zabbix frontend, follow the instructions in the Configure Zabbix frontend section with the following adjustments:
- In the Templates field, type or select the template "MySQL by ODBC" that will be linked to the host.
- Configuring Interfaces is not required.
- The {$MYSQL.DSN} macro value In the Inherited and host macros section of the MySQL server host configuration should be set to the DSN name from the odbc.ini file.
Once you have configured Zabbix frontend, you can view collected metrics, set up problem alerts and test your configuration.
See also
- Creating an item - how to start monitoring additional metrics.
- Problem escalations - how to create multi-step alert scenarios (e.g., first send message to the system administrator, then, if a problem is not resolved in 45 minutes, send message to the data center manager).
- ODBC monitoring - how to set up ODBC on other Linux distributions, and how to start monitoring additional database-related metrics with ODBC.
- Template MySQL by Zabbix agent - additional information about the MySQL by Zabbix agent template.
- Template MySQL by Zabbix agent 2 - additional information about the MySQL by Zabbix agent 2 template.
- Template MySQL by ODBC - additional information about the MySQL by ODBC template.
