You are viewing documentation for the development version, it may be incomplete.
Join our translation project and help translate Zabbix documentation into your native language.
Join our translation project and help translate Zabbix documentation into your native language.
Table of Contents
14 Host navigator
Overview
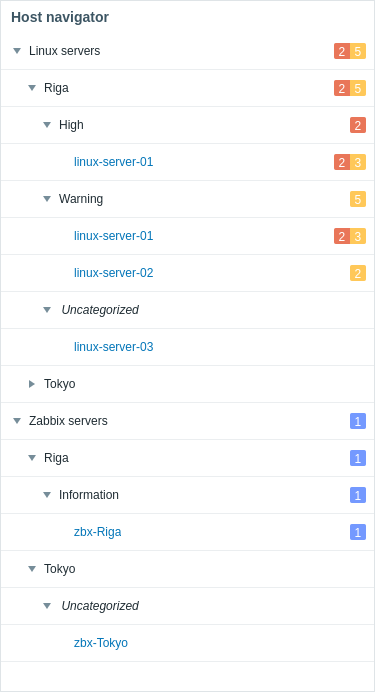
The host navigator widget displays hosts based on various filtering and grouping options.

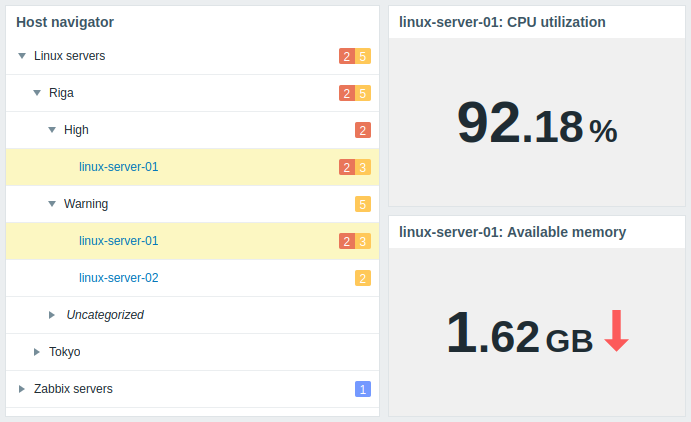
The widget also allows to control the information displayed in other widgets based on the selected host.

Groups by which hosts are organized can be expanded or collapsed.
For groups, problems, and hosts in maintenance, additional details are accessible by mouseover hints.
Configuration
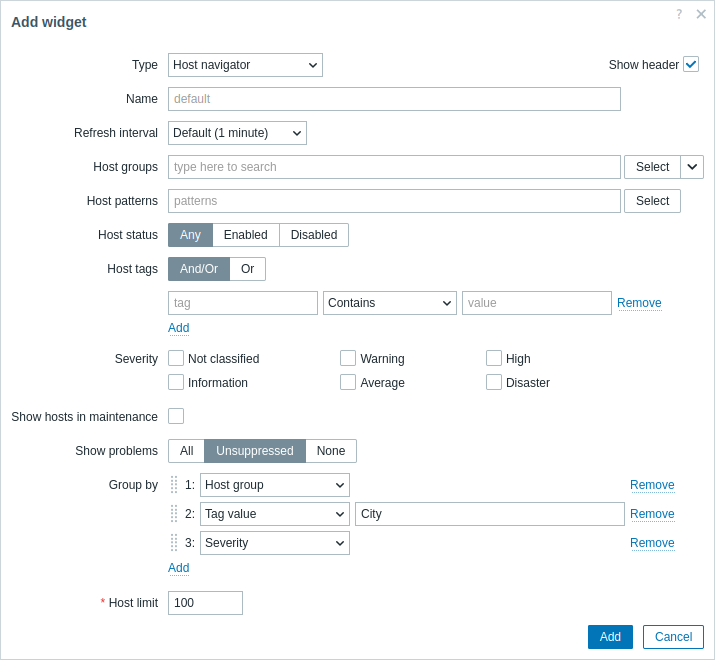
To configure, select Host navigator as type:

In addition to the parameters that are common for all widgets, you may set the following specific options:
| Host groups | Select host groups. Alternatively, select a compatible widget as the data source for host groups. This field is auto-complete, so starting to type the name of a group will offer a dropdown of matching groups. Selecting a parent host group implicitly selects all nested host groups; if no host groups are selected, the widget will display all hosts from all host groups. This parameter is not available when configuring the widget on a template dashboard. |
| Host patterns | Enter host patterns or select existing hosts as host patterns. Hosts that match the specified patterns will be displayed on the host navigator. This field is auto-complete, so starting to type the name of a host will offer a dropdown of matching hosts. If no hosts are selected, the widget will display all hosts. Wildcard patterns may be used for selection (for example, * will return hosts that match zero or more characters; Zabbix* will return hosts that start with "Zabbix").To specify a wildcard pattern, enter the string manually and press Enter. When you start typing, a dropdown list will show matching hosts limited to those belonging to hosts within selected Host groups, if any. This parameter is not available when configuring the widget on a template dashboard. |
| Host status | Filter which hosts to display based on their status (any, enabled, disabled). This parameter is not available when configuring the widget on a template dashboard. |
| Host tags | Specify tags to filter the hosts displayed in the widget. It is possible to include as well as exclude specific tags and tag values. Several conditions can be set. Tag name matching is always case-sensitive. There are several operators available for each condition: Exists - include the specified tag names; Equals - include the specified tag names and values (case-sensitive); Contains - include the specified tag names where the tag values contain the entered string (substring match, case-insensitive); Does not exist - exclude the specified tag names; Does not equal - exclude the specified tag names and values (case-sensitive); Does not contain - exclude the specified tag names where the tag values contain the entered string (substring match, case-insensitive). There are two calculation types for conditions: And/Or - all conditions must be met, conditions having the same tag name will be grouped by the Or condition; Or - enough if one condition is met. This parameter is not available when configuring the widget on a template dashboard. |
| Severity | Mark problem severities to filter hosts with problems to be displayed in the widget. If no severities are marked, all hosts with all problems will be displayed. |
| Show hosts in maintenance | Mark this checkbox to display hosts in maintenance (in this case, maintenance icon will be shown next to the host name). This parameter is labeled Show data in maintenance when configuring the widget on a template dashboard. |
| Show problems | Filter which problems to display with the hosts in the widget based on their status (all, unsuppressed, none). |
| Group by | Add a grouping attribute by which to group the selected hosts: Host group - group hosts by their host group; Tag value - enter a tag name to group hosts by the values of this tag (for example, enter "city" to group hosts by values "Riga", "Tokyo", etc.); Severity - group hosts by their problem severities. If Show problems is configured to display problems, they are displayed as follows: - for each severity group, only the corresponding problem count is displayed; - for each host, all its problem counts are displayed. Note that hosts will be grouped only by those severities marked in the Severity parameter; if no severities are marked, all hosts will be grouped by all severities. Grouping attributes can be reordered by dragging up or down by the handle before the group name. Note that grouping attribute order determines group nesting order. For example, specifying multiple tag names (1: color, 2: city) will result in hosts being grouped by color (red, blue, etc.) and then by city (Riga, Tokyo, etc.). A host may be displayed in multiple groups depending on the configured grouping attributes (for example, when grouping by host group and the host belongs to multiple host groups). Clicking such hosts selects and highlights them in all groups. Hosts that do not match the configured grouping attributes are displayed in the Uncategorized group. Up to 10 grouping attributes can be specified, and all must be unique. If no grouping attributes are specified, hosts will not be grouped. |
| Host limit | Enter the maximum number of hosts to be displayed. Possible values range from 1-9999. When more hosts are available for displaying than the set limit, a corresponding message is shown below the displayed hosts (for example, "100 of 100+ hosts are shown"). Note that the configured host limit also affects the display of configured groups; for example, if host limit is set to 100 and hosts are grouped by tag values (more than 200), only the first 100 tag values with the corresponding hosts will be displayed in the widget. This parameter is not affected by the Limit for search and filter results parameter in Administration → General → GUI. This parameter is not available when configuring the widget on a template dashboard. |
© 2001-2025 by Zabbix SIA. All rights reserved.
Except where otherwise noted, Zabbix Documentation is licensed under the following license
