Join our translation project and help translate Zabbix documentation into your native language.
1 Event menu
Overview
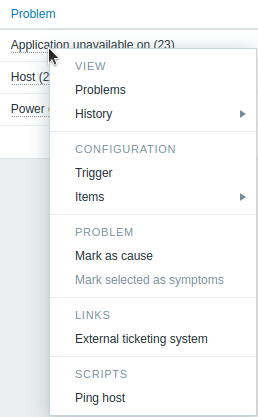
The event menu contains shortcuts to actions or frontend sections that are frequently required for an event.
The event menu can be opened by clicking on the event name.

Content
The event context menu has six sections: View, Actions, Configuration, Problem, Links, and Scripts. For the entities that are not configured, links are disabled and displayed in gray. The sections Scripts and Links are displayed if their entities are configured.
The View section contains links to:
- Problems - opens the list of unresolved problems of the underlying trigger;
- History - leads to the Latest data graph/item history for the underlying item(s). If a trigger uses several items, links will be available for each of them.
The Actions section is available in Trigger overview widgets only. It contains a link to:
- Update problem - opens the problem update screen.
The Configuration section contains links to the configuration of:
- Trigger that fired the problem;
- Items used in the trigger expression.
Note that configuration section is available only for Admin and Super admin users.
The Problem section contains the options to:
- Mark as cause - mark the problem as cause;
- Mark selected as symptoms - mark the selected problems as symptoms of this problem.
The Links section contains links to:
- access a configured trigger URL;
- access custom links configured in Global scripts (with scope 'Manual event action' and type 'URL');
- access a configured external ticket for the problem (see the Include event menu entry option when configuring webhooks).
The Scripts section contains links to execute a global script (with scope Manual event action). This feature may be handy for running scripts used for managing problem tickets in external systems.
Supported locations
The event context menu is accessible by clicking on a problem or event name in various frontend sections, for example:
- Dashboards widgets, such as Problems widget, Trigger overview widget, etc.
- Monitoring → Problems
- Monitoring → Problems → Event details
- Reports → Top 100 triggers (global scripts and access to external ticket are not supported in this location)
