Table of Contents
4 Hosts
Overview
In the Data collection → Hosts section users can configure and maintain hosts.
A listing of existing hosts with their details is displayed.
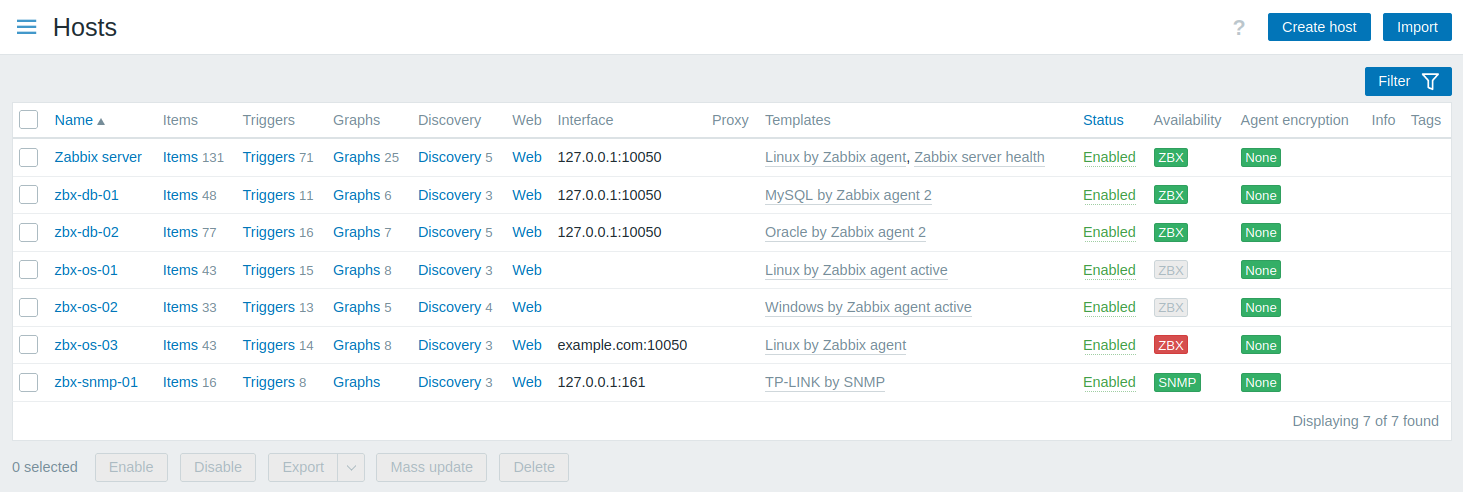
Displayed data:
| Column | Description |
|---|---|
| Name | Name of the host. Clicking on the host name opens the host configuration form. |
| Entities (Items, Triggers, Graphs, Discovery, Web) | Clicking on the entity name will display items, triggers, etc., of the host. The number of the respective entities is displayed in gray. |
| Interface | The main interface of the host is displayed. |
| Proxy | Assigned proxies are displayed in this column: <Proxy name> - host is monitored by standalone proxy (even if the proxy is part of proxy group); <Proxy group name: proxy name> - host is monitored by proxy group, and Zabbix server has assigned a proxy to monitor the host; <Proxy group name> - host is monitored by proxy group without any proxies, or if Zabbix server has not assigned a proxy to monitor the host; Nothing - host is not monitored by either proxy or proxy group. This column is only displayed if the Monitored by filter option is set to 'Any', 'Proxy', or 'Proxy group'. |
| Templates | The templates linked to the host are displayed. If other templates are contained in the linked template, those are displayed in parentheses, separated by a comma. Clicking on a template name will open its configuration form. |
| Status | Host status is displayed - Enabled or Disabled. By clicking on the status you can change it manually. An orange wrench icon Discovered hosts that have been lost are marked with an info icon. The tooltip text provides details on their status. |
| Availability | Host availability per configured interface is displayed. Availability icons represent host interface current status on Zabbix server. Therefore, if you disable a host in the frontend, its availability will update after Zabbix server has synchronized the configuration changes. Similarly, if you enable a host, its availability will update after Zabbix server has synchronized the configuration changes and polled the host. Availability icons represent only those interface types (Agent, SNMP, IPMI, JMX) that are configured. Hovering over the icon displays a pop-up with a list of all interfaces of the same type with details, status, and errors. For Agent interface, the pop-up displays interfaces (passive) and active checks. If a host has active checks only, the Agent interface icon is displayed even if the host does not have an Agent interface configured. The column is empty for hosts with no interfaces. The status of a single host interface is determined by the connection between an enabled item using the interface and the host. The status can be: Available - the connection to the host was successful; Not available - the connection to the host was unsuccessful (timeout, firewall issues, etc.); Unknown - the connection to the host has not been attempted or the result is unknown. For additional details on how Zabbix server determines interface status, see Unknown interface status and Unreachable/unavailable host interface settings. The status of all host interfaces of a single type (Agent, SNMP, IPMI, JMX) is determined by those interfaces that are used by at least one enabled item. The status is indicated by the icon color: Green - all interfaces are available; Yellow - at least one interface is not available, and at least one is available or unknown; Red - all interfaces are not available; Gray - at least one interface is unknown, but none are not available. Active check availability. If at least one active check is enabled on the host, active checks also affect the total Agent interface availability as described above. To determine active check availability, heartbeat messages are sent in the agent active check thread. The frequency of heartbeat messages is controlled by the HeartbeatFrequency parameter in Zabbix agent or agent 2 configuration (default 60 seconds, range 0-3600). Active checks are considered not available when the active check heartbeat is older than 2 x HeartbeatFrequency seconds.Note: Zabbix agents older than version 6.2.x do not send active check heartbeats, so the availability of their hosts remains unknown. |
| Agent encryption | Encryption status for connections to the host is displayed: None - no encryption; PSK - using pre-shared key; Cert - using certificate. |
| Info | Error information (if any) regarding the host is displayed. |
| Tags | Tags of the host with macros unresolved. |
To configure a new host, click on the Create host button in the top right-hand corner. To import a host from a YAML, XML, or JSON file, click on the Import button in the top right-hand corner.
Mass editing options
Buttons below the list offer some mass editing options:
- Enable - change host status to Monitored;
- Disable - change host status to Not monitored;
- Export - export the hosts to a YAML, XML or JSON file;
- Mass update - update several properties for a number of hosts at once;
- Delete - delete the hosts.
To use these options, mark the checkboxes before the respective hosts, then click on the required button.
Using filter
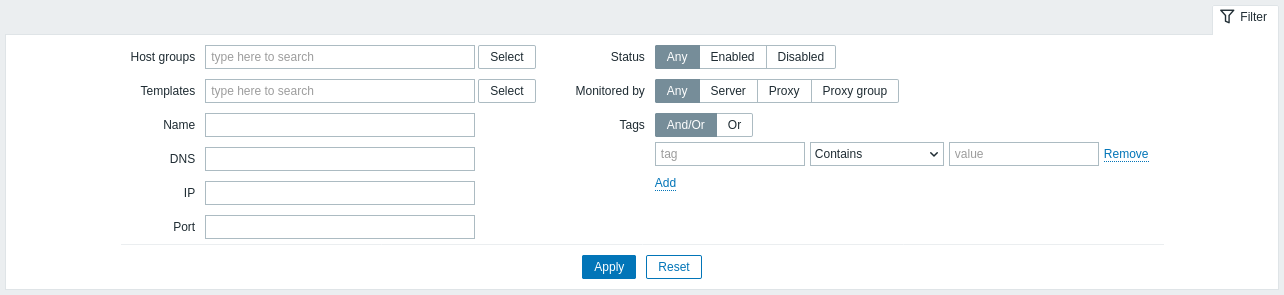
You can use the filter to display only the hosts you are interested in. For better search performance, data is searched with macros unresolved.
The Filter icon is available at the top right corner. Clicking on it will open a filter where you can specify the desired filtering criteria.
| Parameter | Description |
|---|---|
| Host groups | Filter by one or more host groups. Specifying a parent host group implicitly selects all nested host groups. |
| Templates | Filter by linked templates. |
| Name | Filter by visible host name. |
| DNS | Filter by DNS name. |
| IP | Filter by IP address. |
| Port | Filter by port number. |
| Status | Filter by host status. |
| Monitored by | Filter hosts that are monitored by Zabbix server, proxy, or proxy group. |
| Proxies | Filter hosts that are monitored by the proxies specified here. This field is only available if "Proxy" is selected in the Monitored by field. |
| Proxy groups | Filter hosts that are monitored by the proxy groups specified here. This field is only available if "Proxy group" is selected in the Monitored by field. |
| Tags | Filter by host tag name and value. It is possible to include as well as exclude specific tags and tag values. Several conditions can be set. Tag name matching is always case-sensitive. There are several operators available for each condition: Exists - include the specified tag names; Equals - include the specified tag names and values (case-sensitive); Contains - include the specified tag names where the tag values contain the entered string (substring match, case-insensitive); Does not exist - exclude the specified tag names; Does not equal - exclude the specified tag names and values (case-sensitive); Does not contain - exclude the specified tag names where the tag values contain the entered string (substring match, case-insensitive). There are two calculation types for conditions: And/Or - all conditions must be met, conditions having the same tag name will be grouped by the Or condition; Or - enough if one condition is met. |
Unknown interface status
Zabbix server displays the "Unknown" status for a host interface (Agent, SNMP, IPMI, JMX) in the following cases:
- Host is disabled.
- Host is set to be monitored by proxy, different proxy, or server if it was previously monitored by proxy.
- Host is monitored by a proxy that appears to be offline (no updates received from the proxy during the maximum heartbeat interval - 1 hour).
- All host items with that interface type are disabled.
- No pollers for that interface type have been configured (for example, the
StartAgentPollersorStartSNMPPollersserver configuration parameter is set to0).
Interface availability is set to "Unknown" after Zabbix server configuration cache synchronization.
Interface availability (Available/Not available) on hosts monitored by proxies is restored after proxy configuration cache synchronization.