Is this not what you were looking for? Switch to the current version or choose one from the drop-down menu.
4 Latest data
Overview
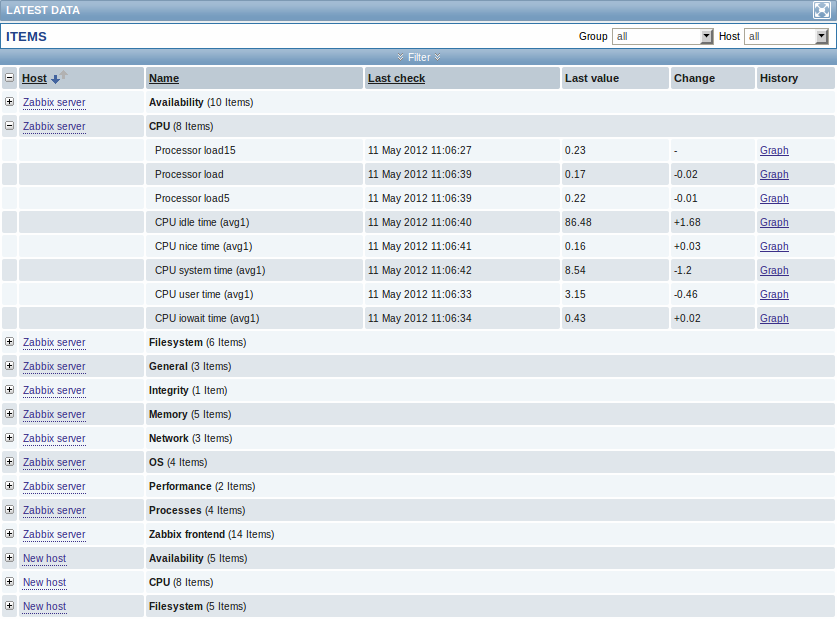
The Monitoring → Latest data section displays the latest values gathered by items.
Just click on '+' before a host and the relevant application, and the items of that host and application will be displayed with their latest values.

You can expand all hosts and all applications, thus revealing all items by clicking on '+' in the header row.
Items are displayed with their name, last check time, last value, change amount and a link to a simple graph/history of item values.
Using filter
You can use the filter to display only the items you are interested in. The filter link is located above the table in the middle. You can use it to filter items by a string in the name; you can also select to display items that have no data gathered.

Links to value history/simple graph
The last column in the latest value list offers:
- a History link (for all textual items) - leading to listings (Values/500 latest values) displaying the history of previous item values.
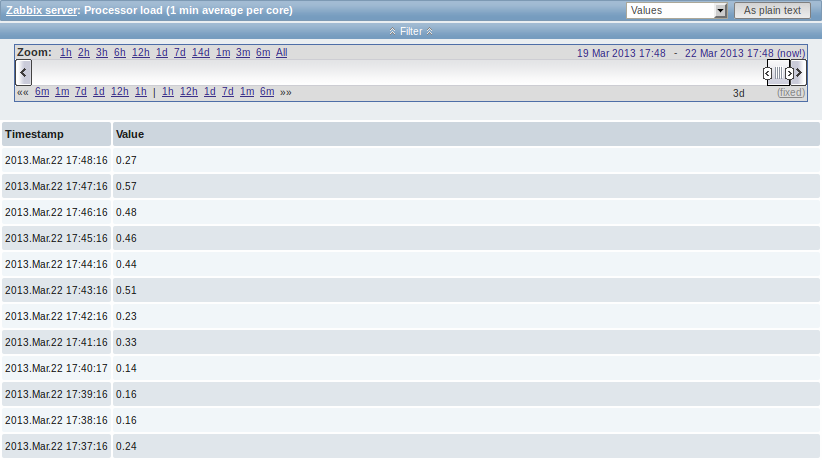
- a Graph link (for all numeric items) - leading to a simple graph. However, once the graph is displayed, a dropdown on the upper right offers a possibility to switch to Values/500 latest values as well.

The values displayed in this list are "raw", that is, no postprocessing is applied.
The total amount of values displayed is defined by the value of Search/Filter elements limit parameter, set in Administration → General.
