Is this not what you were looking for? Switch to the current version or choose one from the drop-down menu.
9 Queue
Overview
The queue displays items that are waiting for a refresh. The queue is just a logical representation of data from the database. There is no IPC queue or any other queue mechanism in Zabbix.
Statistics shown by the queue is a good indicator of the performance of Zabbix server.
Reading the queue
To read the queue, go to Administration → Queue. Overview should be selected in the dropdown to the right.

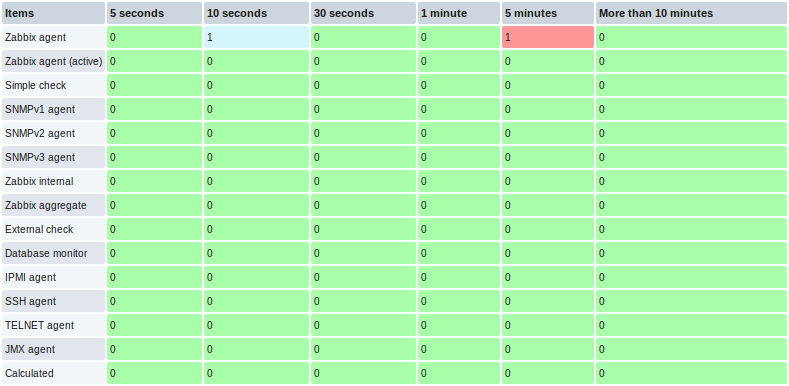
The picture here is generally "green" so we may assume that the server is doing fine.
The queue shows one item waiting for 10 seconds and one for 5 minutes. Nice, it would be great to know what items these are.
To do just that, select Details in the dropdown in the upper right corner. Now you can see a list of those delayed items.

With these details provided it may be possible to find out why these items might be delayed.
With one or two delayed items there perhaps is no cause for alarm. They might get updated in a second. However, if you see a bunch of items getting delayed for too long, there might be a more serious problem.

Is the agent down?
Delay for remote node items
Queue information from a child node is not up-to-date. The master node receives historical data with a certain delay (normally, up-to 10 seconds for inter-node data transfer), so the information is delayed.
The information from a child node also depends on:
- performance of the child node
- communications between master and child nodes
- possible local time difference between master and child nodes
Queue item
A special internal item zabbix[queue,<from>,<to>] can be used to monitor the health of the queue in Zabbix. It will return the number of items delayed by the set amount of time. For more information see Internal items.
