这是原厂英文文档的翻译页面. 欢迎帮助我们 完善文档.
26 Top 主机
概述
此组件提供了一种创建自定义表格来显示数据情况的方法, 允许显示Top N 类报告和进度条报告,这些报告对容量规划很有用。
最多可显示 100 个主机。


配置
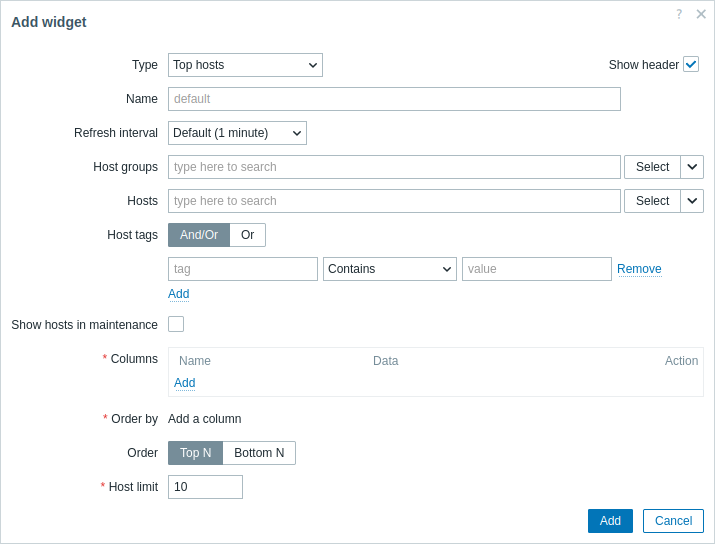
要配置,请选择 Top 主机 作为类型:

除了所有组件的 通用 参数外,您还可以设置以下特定选项:
| 主机组 | 选择要在组件中显示的主机组。 或者,选择兼容的组件作为主机组的 数据源。 此字段是自动完成的,因此开始输入组的名称时将提供匹配组的下拉列表。 在 模板仪表板 上配置组件时,此参数不可用。 |
| 主机 | 选择要在组件中显示的主机。 或者,选择兼容的组件或仪表板作为主机的数据源。 此字段是自动完成的,因此开始输入主机名称时将提供匹配主机的下拉列表。 在模板仪表板上配置组件时,此参数不可用。 |
| 主机标签 | 指定标签以限制组件中显示的主机数量。 可以包含和排除特定标签和标签值。可以设置多个条件。标签名称匹配始终区分大小写。 每个条件都有多个可用的运算符: 存在 - 包含指定的标签名称; 等于 - 包含指定的标签名称和值(区分大小写); 包含 - 包含指定的标签名称,其中标签值包含输入的字符串(子字符串匹配,不区分大小写); 不存在 - 排除指定的标签名称; 不等于 - 排除指定的标签名称和值(区分大小写); 不包含 - 排除指定的标签名称,其中标签值包含输入的字符串(子字符串匹配,不区分大小写)。 条件有两种计算类型: 与/或 - 必须满足所有条件,具有相同标签名称的条件将按或条件分组; 或 - 只要满足一个条件就足够了。 在 模板仪表板。 |
| 显示维护中的主机 | 选中此复选框,则维护中的主机也会显示(在这种情况下,主机名旁边将显示维护图标)。默认情况下未选中。 |
| 列 | 添加要显示的数据列。 列顺序决定了它们从左到右的显示。 可以通过拖动列名前的手柄上下排列来重新排列列。 |
| 排序依据 | 从定义的列列表中指定用于前 N或后 N排序的列。 |
| 排序 | 指定行的排序: 前 N - 根据排序依据聚合值降序排列; 后 N - 根据排序依据聚合值升序排列。 |
| 主机限制 | 要显示的主机行数(1-100)。 在[模板仪表板](/manual/config/templates/template#adding-dashboards)上配置组件时,此参数不可用。 |
列配置

Host name column
Host name column is used to display the name of the host.

Supported parameters:
| Name | Name of the column. |
| Data | Data type to display in the column, select Host name. |
| Base color | Background color of the column. |
Text column
Text column is used to display any specified text string.

Supported parameters:
| Name | Name of the column. |
| Data | Data type to display in the column, select Text. |
| Base color | Background color of the column. |
| Text | Enter the string to display. May contain host and inventory macros. |
Item value column
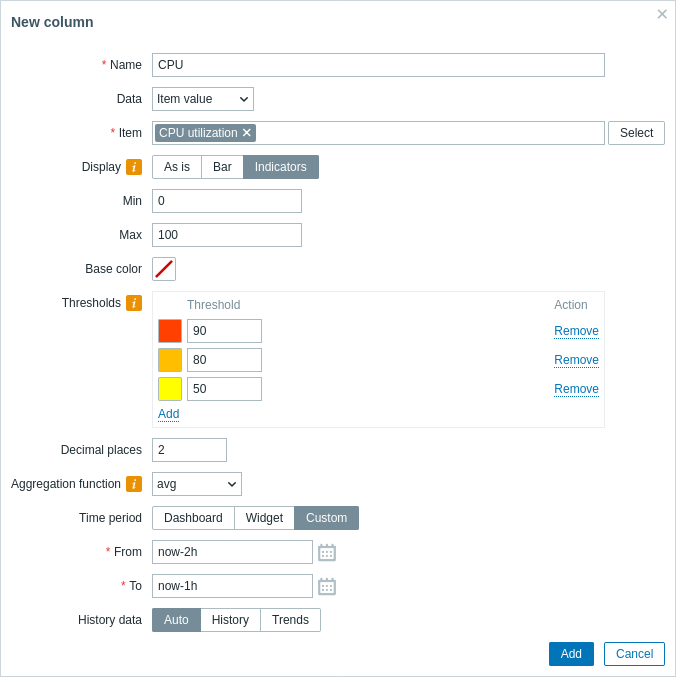
Item value column is used to display value of the specified item; it supports multiple value display formats and options.

Supported parameters:
| Name | Name of the column. |
| Data | Data type to display in the column, select Item value. |
| Item name | Select the item. When configuring the widget on a template dashboard, only items configured on the template can be selected. |
| Base color | Background color of the column; fill color if Item value data is displayed as bar/indicators. The default color can be overridden by custom color, if the item value is over one of the specified thresholds. |
| Display item value as | Format for displaying the item value: Numeric, Text, or Binary. The selected option determines which additional parameters will be available. Refer to the parameter list for each format below. |
| Advanced configuration | |
| Aggregation function | Specify which aggregation function to use: min - display the smallest value; max - display the largest value; avg - display the average value; count - display the count of values; sum - display the sum of values; first - display the first value; last - display the last value; not used - display the most recent value (no aggregation). Aggregation allows to display an aggregated value for the chosen interval (5 minutes, an hour, a day), instead of the most recent value. Only numeric data can be displayed for min, max, avg and sum. For count, non-numeric data will be changed to numeric. |
| Time period | Specify the time period to use for aggregating values: Dashboard - use time period of the dashboard; Widget - use time period of the specified widget; Custom - use a custom time period. This parameter will not be displayed if Aggregation function is set to "not used". |
| Widget | Select the widget. This parameter will only be displayed if Time period is set to "Widget". |
| From | Select the time period from (default value now-1h). See relative time syntax.This parameter will only be displayed if Time period is set to "Custom". |
| To | Select the time period to (default value now). See relative time syntax.This parameter will only be displayed if Time period is set to "Custom". |
| History data | Take data from history or trends: Auto - automatic selection; History - take history data; Trends - take trend data. This parameter is available only for numeric item values. For text and binary values data will always be taken from history. |
Numeric item value parameters:
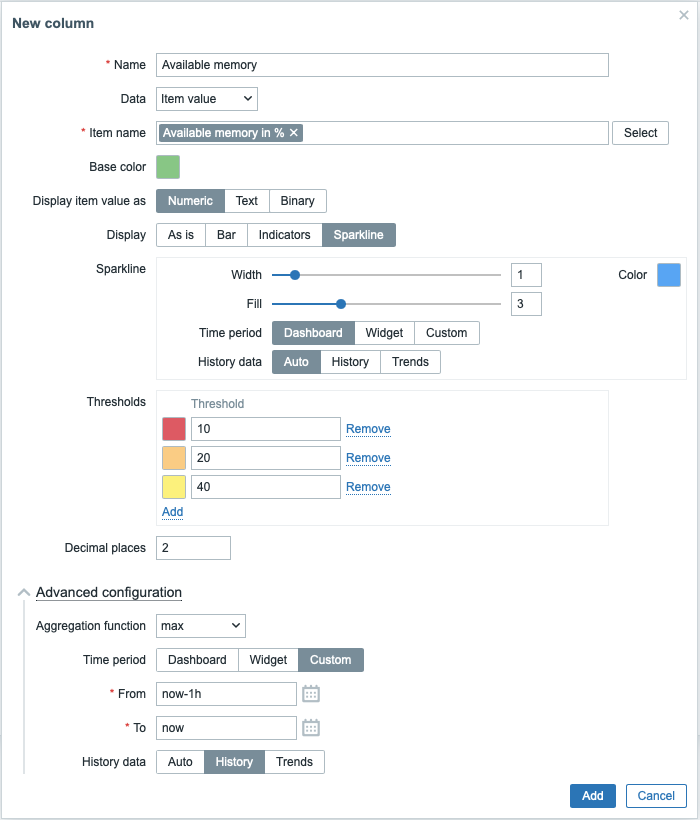
| Display | Define how the value should be displayed: As is - as regular text; Bar - as solid, color-filled bar; Indicators - as segmented, color-filled bar; Sparkline - mini line graph. |
| Thresholds | Specify threshold values when the background/fill color should change. The list will be sorted in ascending order when saved. For sparklines, thresholds are applied only to the item last value. |
| Decimal places | Specify how many decimal places will be displayed with the value. |
| Bar/Indicators | |
| Min | Minimum value. |
| Max | Maximum value. |
| Sparkline | |
| Width | Set the graph line thickness by using the slider or manually entering a value in the range from 0 to 10. |
| Color | Select line and fill color. |
| Fill | Set fill color transparency level by using the slider or manually entering a value in the range from 0 to 10. |
| Time period | Specify the time period for values to be included into the sparkline chart: Dashboard - use time period of the dashboard; Widget - use time period of the specified widget; Custom - use a custom time period. Note that the time period affects only the sparkline chart. The value displayed next to the sparkline represents the last value of the item, not the last value in the selected time period. |
| Widget | Select the widget. This parameter will only be displayed if Time period is set to "Widget". |
| From | Select the time period from (default value now-1h). See relative time syntax.This parameter will only be displayed if Time period is set to "Custom". |
| To | Select the time period to (default value now). See relative time syntax.This parameter will only be displayed if Time period is set to "Custom". |
| History data | Take data from history or trends: Auto - automatic selection; History - take history data; Trends - take trend data. |
Text item value parameters:
| Highlights | Specify the regular expressions upon matching which the background/fill color should change. |
Binary item value parameters:
| Show thumbnail | Specify whether to create and display a thumbnail for the image containing binary data or to display a hyperlink Show leading to the full-size image in the value column. |
© 2001-2025 by Zabbix SIA. All rights reserved.
Except where otherwise noted, Zabbix Documentation is licensed under the following license

