27 Principales equipos
Descripción general
El widget de principales equipos proporciona una forma de crear tablas personalizadas para mostrar datos de varios equipos y puede utilizarse para crear informes tipo Top N e informes de barra de progreso útiles para la planificación de capacidad. El tipo de datos a mostrar es personalizable y puede incluir uso de CPU, disponibilidad de memoria o cualquier otro valor recopilado en formato numérico, de texto o binario, así como cadenas de texto estáticas. Los datos pueden presentarse en varios formatos, como barras, indicadores o gráficos de líneas.
El número máximo de equipos que se pueden mostrar es 1000.


Configuración
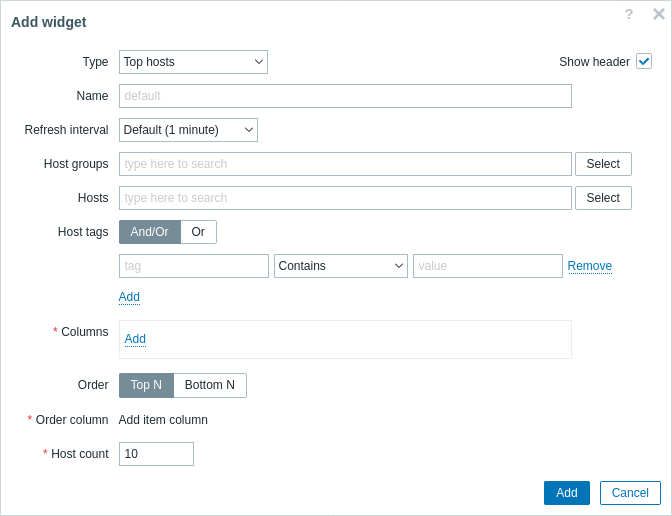
Para configurar, seleccione Equipos Top como tipo:

Además de los parámetros que son comunes para todos los widgets, puede establecer las siguientes opciones específicas:
| Grupos de equipos | Seleccione los grupos de equipos que se mostrarán en el widget. Alternativamente, seleccione un widget compatible como fuente de datos para los grupos de equipos. Este campo es autocompletado, por lo que al comenzar a escribir el nombre de un grupo se ofrecerá un menú desplegable con los grupos coincidentes. Este parámetro no está disponible al configurar el widget en un panel de plantilla. |
| Equipos | Seleccione los equipos que se mostrarán en el widget. Alternativamente, seleccione un widget compatible o el panel como fuente de datos para los equipos. Este campo es autocompletado, por lo que al comenzar a escribir el nombre de un equipo se ofrecerá un menú desplegable con los equipos coincidentes. Este parámetro no está disponible al configurar el widget en un panel de plantilla. |
| Etiquetas de equipo | Especifique etiquetas para limitar el número de equipos mostrados en el widget. Es posible incluir así como excluir etiquetas y valores de etiquetas específicos. Se pueden establecer varias condiciones. La coincidencia de nombres de etiquetas siempre distingue entre mayúsculas y minúsculas. Hay varios operadores disponibles para cada condición: Existe: incluye los nombres de etiquetas especificados; Igual: incluye los nombres y valores de etiquetas especificados (distingue mayúsculas y minúsculas); Contiene: incluye los nombres de etiquetas especificados donde los valores de las etiquetas contienen la cadena introducida (coincidencia de subcadena, no distingue mayúsculas y minúsculas); No existe: excluye los nombres de etiquetas especificados; No es igual: excluye los nombres y valores de etiquetas especificados (distingue mayúsculas y minúsculas); No contiene: excluye los nombres de etiquetas especificados donde los valores de las etiquetas contienen la cadena introducida (coincidencia de subcadena, no distingue mayúsculas y minúsculas). Hay dos tipos de cálculo para las condiciones: Y/O: se deben cumplir todas las condiciones, las condiciones que tengan el mismo nombre de etiqueta se agruparán por la condición O; O: basta con que se cumpla una condición. Este parámetro no está disponible al configurar el widget en un panel de plantilla. |
| Mostrar equipos en mantenimiento | Marque esta casilla para que los equipos en mantenimiento también se muestren (en este caso, se mostrará un icono de mantenimiento junto al nombre del equipo). Desmarcado por defecto. |
| Columnas | Agregue columnas de datos para mostrar. El orden de las columnas determina su visualización de izquierda a derecha. Las columnas se pueden reordenar arrastrándolas hacia arriba y hacia abajo usando el manejador antes del nombre de la columna. |
| Ordenar por | Especifique la columna de la lista de Columnas definida que se utilizará para el orden Top N o Bottom N. |
| Orden | Especifique el orden de las filas: Top N: en orden descendente según el valor agregado de Ordenar por; Bottom N: en orden ascendente según el valor agregado de Ordenar por. |
| Límite de equipos | Número de filas de equipos a mostrar (1-1000). Este parámetro no está disponible al configurar el widget en un panel de plantilla. |
Configuración de columnas
Es posible añadir columnas de tres tipos de datos: nombre de host, valor de elemento o texto. La lista de parámetros de columna disponibles depende del tipo de dato de la columna y, para el tipo valor de elemento, del formato del valor.
Columna de nombre de host
La columna de nombre de host se utiliza para mostrar el nombre del host.

Parámetros soportados:
| Nombre | Nombre de la columna. |
| Datos | Tipo de datos a mostrar en la columna, seleccione Nombre de host. |
| Color base | Color de fondo de la columna. |
Columna de texto
La columna de texto se utiliza para mostrar cualquier cadena de texto especificada.

Parámetros soportados:
| Nombre | Nombre de la columna. |
| Datos | Tipo de datos a mostrar en la columna, seleccione Texto. |
| Color base | Color de fondo de la columna. |
| Texto | Introduzca la cadena a mostrar. Puede contener macros de host e inventario. |
Columna de valor de elemento
La columna de valor de elemento se utiliza para mostrar el valor del elemento especificado; admite múltiples formatos y opciones de visualización de valores.

Parámetros admitidos:
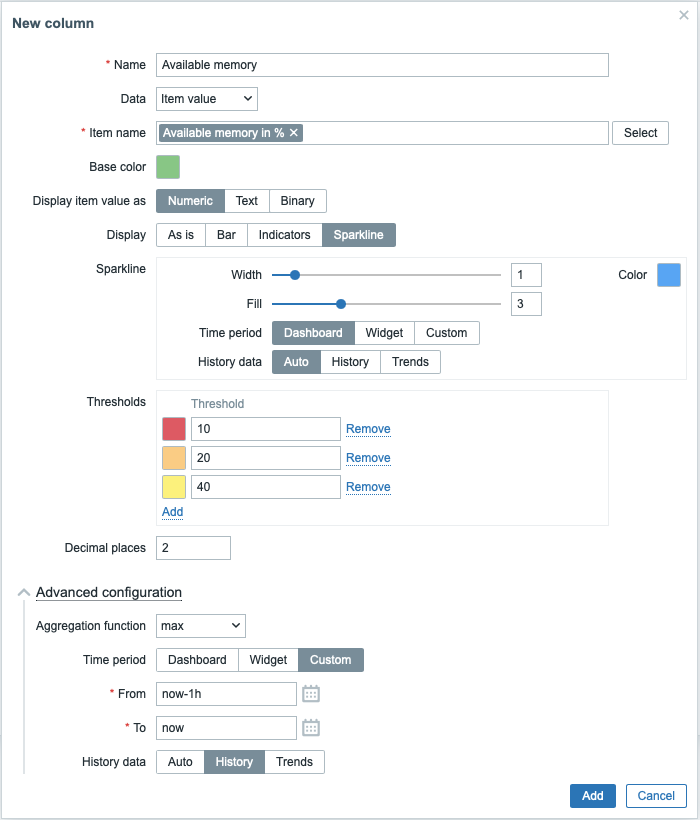
| Nombre | Nombre de la columna. |
| Datos | Tipo de dato a mostrar en la columna, seleccione Valor de elemento. |
| Nombre del elemento | Seleccione el elemento. Al configurar el widget en un panel de plantilla, solo se pueden seleccionar elementos configurados en la plantilla. |
| Color base | Color de fondo de la columna; color de relleno si los datos de Valor de elemento se muestran como barra/indicadores. El color predeterminado puede ser sobrescrito por un color personalizado, si el valor del elemento supera uno de los umbrales especificados. |
| Mostrar valor de elemento como | Formato para mostrar el valor del elemento: Numérico, Texto o Binario. La opción seleccionada determina qué parámetros adicionales estarán disponibles. Consulte la lista de parámetros para cada formato a continuación. |
| Configuración avanzada | |
| Función de agregación | Especifique qué función de agregación utilizar: min - mostrar el valor más pequeño; max - mostrar el valor más grande; avg - mostrar el valor promedio; count - mostrar el recuento de valores; sum - mostrar la suma de valores; first - mostrar el primer valor; last - mostrar el último valor; no usado - mostrar el valor más reciente (sin agregación). La agregación permite mostrar un valor agregado para el intervalo elegido (5 minutos, una hora, un día), en lugar del valor más reciente. Solo se pueden mostrar datos numéricos para min, max, avg y sum. Para count, los datos no numéricos se convertirán a numéricos. |
| Período de tiempo | Especifique el período de tiempo a utilizar para agregar valores: Panel - usar el período de tiempo del panel; Widget - usar el período de tiempo del widget especificado; Personalizado - usar un período de tiempo personalizado. Este parámetro no se mostrará si la Función de agregación está configurada en "no usado". |
| Widget | Seleccione el widget. Este parámetro solo se mostrará si el Período de tiempo está configurado en "Widget". |
| Desde | Seleccione el período de tiempo desde (valor predeterminado now-1h). Consulte la sintaxis de tiempo relativo.Este parámetro solo se mostrará si el Período de tiempo está configurado en "Personalizado". |
| Hasta | Seleccione el período de tiempo hasta (valor predeterminado now). Consulte la sintaxis de tiempo relativo.Este parámetro solo se mostrará si el Período de tiempo está configurado en "Personalizado". |
| Datos históricos | Tomar datos del historial o de tendencias: Auto - selección automática; Historial - tomar datos del historial; Tendencias - tomar datos de tendencias. Este parámetro solo está disponible para valores de elementos numéricos. Para valores de texto y binarios, los datos siempre se tomarán del historial. |
Parámetros de valor de elemento numérico:
| Mostrar | Defina cómo se debe mostrar el valor: Tal cual - como texto normal; Barra - como barra sólida, rellena de color; Indicadores - como barra segmentada, rellena de color; Sparkline - mini gráfico de líneas. |
| Umbrales | Especifique los valores de umbral cuando el color de fondo/relleno debe cambiar. La lista se ordenará en orden ascendente al guardar. Para sparklines, los umbrales solo se aplican al último valor del elemento. |
| Decimales | Especifique cuántos decimales se mostrarán con el valor. |
| Barra/Indicadores | |
| Mín | Valor mínimo. |
| Máx | Valor máximo. |
| Sparkline | |
| Ancho | Establezca el grosor de la línea del gráfico usando el control deslizante o ingresando manualmente un valor en el rango de 0 a 10. |
| Color | Seleccione el color de la línea y el relleno. |
| Relleno | Establezca el nivel de transparencia del color de relleno usando el control deslizante o ingresando manualmente un valor en el rango de 0 a 10. |
| Período de tiempo | Especifique el período de tiempo para los valores que se incluirán en el gráfico sparkline: Panel - usar el período de tiempo del panel; Widget - usar el período de tiempo del widget especificado; Personalizado - usar un período de tiempo personalizado. Tenga en cuenta que el período de tiempo solo afecta al gráfico sparkline. El valor que se muestra junto al sparkline representa el último valor del elemento, no el último valor en el período de tiempo seleccionado. |
| Widget | Seleccione el widget. Este parámetro solo se mostrará si el Período de tiempo está configurado en "Widget". |
| Desde | Seleccione el período de tiempo desde (valor predeterminado now-1h). Consulte la sintaxis de tiempo relativo.Este parámetro solo se mostrará si el Período de tiempo está configurado en "Personalizado". |
| Hasta | Seleccione el período de tiempo hasta (valor predeterminado now). Consulte la sintaxis de tiempo relativo.Este parámetro solo se mostrará si el Período de tiempo está configurado en "Personalizado". |
| Datos históricos | Tomar datos del historial o de tendencias: Auto - selección automática; Historial - tomar datos del historial; Tendencias - tomar datos de tendencias. |
Parámetros de valor de elemento de texto:
| Resaltados | Especifique las expresiones regulares con las que, al coincidir, el color de fondo/relleno debe cambiar. |
Parámetros de valor de elemento binario:
| Mostrar miniatura | Especifique si se debe crear y mostrar una miniatura para la imagen que contiene datos binarios o mostrar un hipervínculo Mostrar que conduce a la imagen de tamaño completo en la columna de valor. |

