
10 使用Zabbix监控网络交换机或路由器
介绍
本指南将引导您完成使用Zabbix对网络交换机或路由器进行基础监控所需的步骤。 示例采用思科路由器,但该流程适用于任何支持SNMP的网络设备。
目标读者
本指南面向需要快速启用网络设备基础监控的Zabbix新用户和网络管理员。 如需深度定制或高级配置选项,请参阅SNMP agent页面或Zabbix手册中的Configuration章节。
先决条件
开始前请确保已具备:
- 已安装Zabbix server和Zabbix前端:根据操作系统安装指南部署(参见Installation from packages和Web interface installation)
- 支持SNMP的设备:已启用SNMP的网络交换机或路由器(如思科路由器)
- 已安装MIB files:MIB文件可使Zabbix将数字OID转换为可读名称和描述 若缺少MIB支持,您可能仅能看到数值,这将增加配置监控项和故障排查问题的难度
Ubuntu系统安装MIB文件:
1. 安装MIB下载工具包:
sudo apt-get update
sudo apt-get install snmp-mibs-downloader
如需添加厂商特定MIB(如思科、Juniper),将其放置到对应目录:
- Linux系统常见路径:/usr/share/snmp/mibs/ 或 /usr/local/share/snmp/mibs/
- Zabbix安装路径:/var/lib/zabbix/mibs/
确保MIBDIRS环境变量或snmp.conf的file包含正确路径
验证系统是否识别新MIB:
snmptranslate -IR -On <MIB-NAME>::<object>详细说明请参考SNMP库文档:
2. 编辑/etc/snmp/snmp.conf并注释以mibs :开头的行以加载所有可用MIB
3. 通过运行snmpwalk(例如snmpwalk -v 2c -c <your_community_string> <device_IP>)验证OID是否显示描述性名称
本指南基于以下环境:
- Zabbix version: 7.0(软件包安装)
- 操作系统发行版: Ubuntu
- 操作系统version: 24.04.2+
- Zabbix组件: server、frontend及可选的agent(如需监控本地网络指标)
- 数据库: MySQL
- Web服务器: Apache
- 网络设备: Cisco Catalyst 3750V2-24FS
假设您的网络设备已完成物理安装和连接
配置网络设备(Cisco路由器示例)
要通过SNMP进行监控,您必须配置网络设备以允许SNMP queries。 以下示例适用于SNMPv2且不考虑现有设置。 注意:应用这些命令可能会覆盖当前的SNMP配置。
对于Cisco路由器,配置通常涉及以下步骤。
SNMPv2示例
1. 启用SNMP并设置团体字符串string.
Log in 连接到您的Cisco路由器控制台并进入配置模式:
configure terminal然后,enable SNMP 通过指定只读团体字符串string. 例如:
snmp-server community <your_community_string> RO将<your_community_string>替换为您安全的团体字符串string.
注意: RO(只读)选项允许SNMP从设备检索数据但阻止任何配置更改.
出于安全考虑,建议将SNMP访问限制在仅必要的设备上. 有关配置访问控制列表(ACLs)的更多指导,请参阅Cisco's official documentation.
2. 保存配置.
保存您的更改以确保SNMP设置在重启后仍然有效:
write memorySNMPv3示例
SNMPv3通过认证和加密提供增强的安全性。 其配置比SNMPv2更安全,应参照设备特定文档进行验证。
1. 创建SNMP组。
配置启用隐私(加密)的SNMPv3组:
configure terminal
snmp-server group <your_group> v3 priv
2. 创建SNMP用户。
添加具有认证和隐私功能的SNMPv3用户。 将占位符替换为您需要的值:
snmp-server user <your_user> <your_group> v3 auth md5 <auth_password> priv aes 128 <priv_password>3. 保存配置:
write memory如需更多详情或型号特定说明,可参考外部Cisco SNMP configuration tutorials。 本指南仅提供启用SNMP监控的基本步骤。
配置Zabbix前端
在Zabbix前端创建主机
1. 登录Zabbix前端界面.
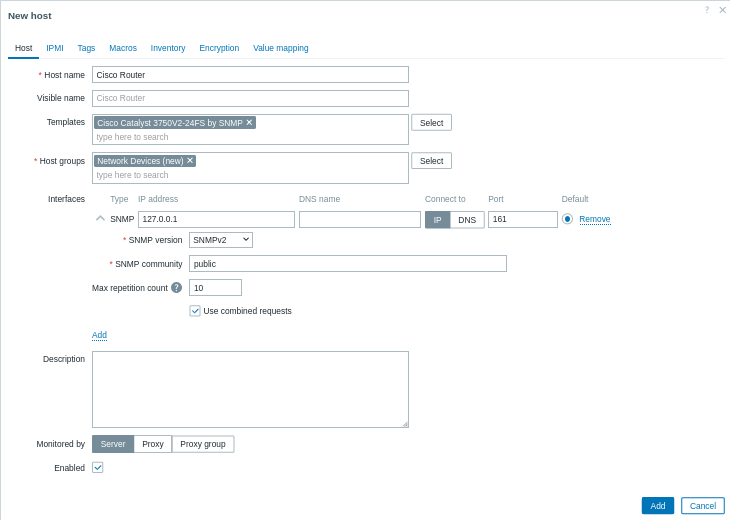
2. 添加一个新的主机.
导航至数据采集 > 主机并点击创建主机.
- 主机名: 输入设备名称(例如"Cisco路由器").
- 主机组: 选择现有组或create新组如"网络设备".
-
接口:
- Click Add under Interfaces.
- Choose SNMP as the interface type.
- Enter the IP address or DNS name of your Cisco router.
- Set the default SNMP port (usually 161).
- Use the drop-down menu to select the appropriate SNMP version (e.g. SNMPv2).
- For SNMPv1/v2, enter the community string in the SNMP community field. For SNMPv3, additional credentials (Context name, Security name, and Security level, etc.) will be prompted.
3. 链接模板
在模板字段中, 选择最匹配您设备的SNMP模板. Zabbix为多种设备系列提供了预建的设备. 例如, 如果您正在监控Cisco设备, 请选择与设备操作系统或型号对应的模板(如Cisco IOS SNMP或Cisco Catalyst 3750<设备型号> SNMP).
4. 点击添加保存主机.

查看收集的指标
恭喜!Zabbix 现在已配置为监控您的网络设备。
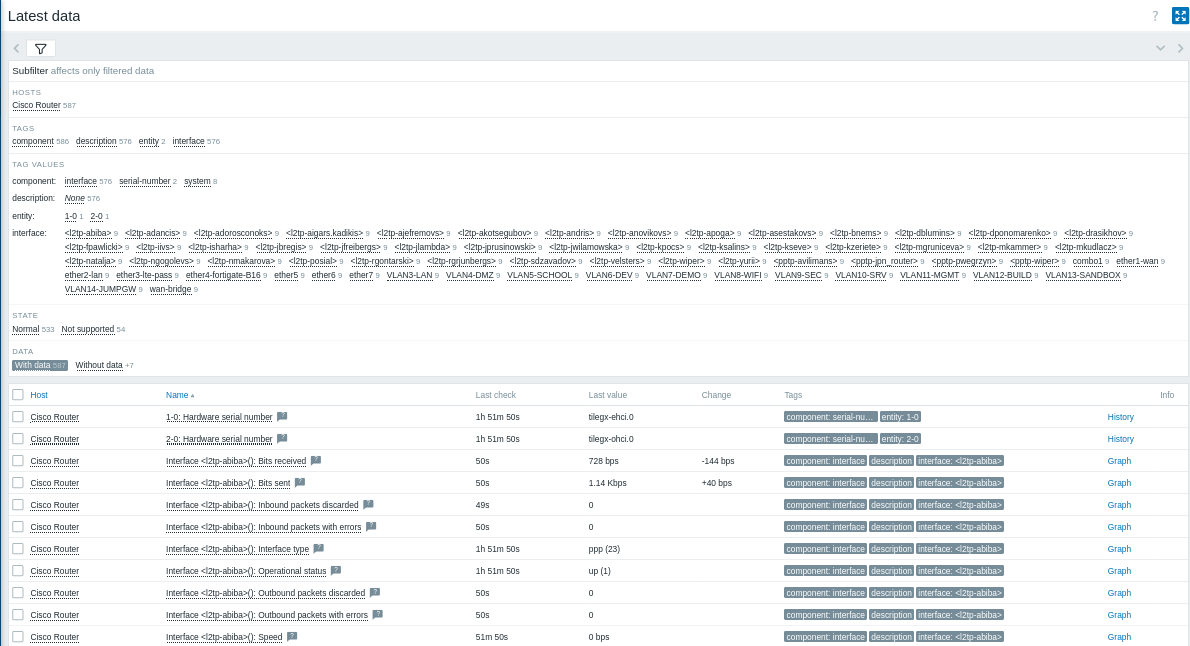
最新数据:
- 在 Zabbix 前端中,导航到 Monitoring > Latest data(监控 > 最新数据)。
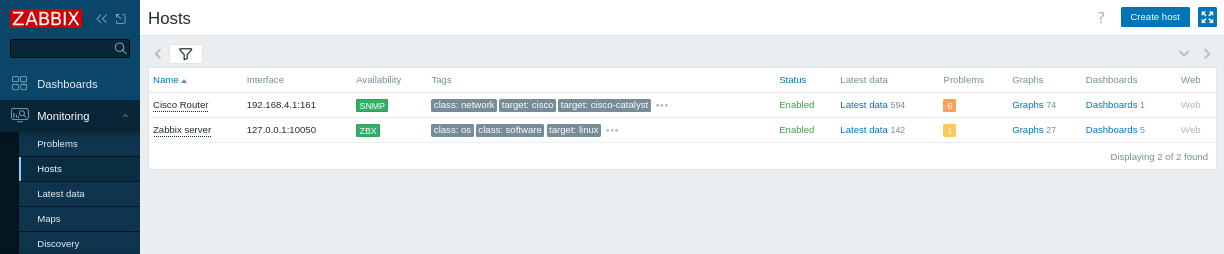
- 选择您的 “Cisco Router”(Cisco 路由器)主机(或已发现的 主机),以查看诸如硬件和网络运行时间、ICMP 丢包率、Ping 和响应时间等指标。
- 图表和屏幕:
要可视化性能数据,请点击 SNMP 监控项 旁边的 Graphs(图表)以查看详细指标。
下一步您可以:
- 添加自定义 SNMP 监控项 以监控更多指标。
- 设置问题告警 以接收有关潜在 问题 的通知。
创建SNMP监控项
当主机设置完成后,您可以create监控项来监控特定指标。 注意:如果使用模板,此步骤为可选,因为模板已包含默认的监控项集合。
1. 识别SNMP OID:
使用snmpwalk命令列出设备上可用的OID。
例如:
snmpwalk -v 2c -c <your_community_string> <device_IP> .找到您希望监控的指标对应的OID(例如,IF-MIB::ifHCInOctets.3表示端口3的入站流量)。 要get数字OID,可以使用:
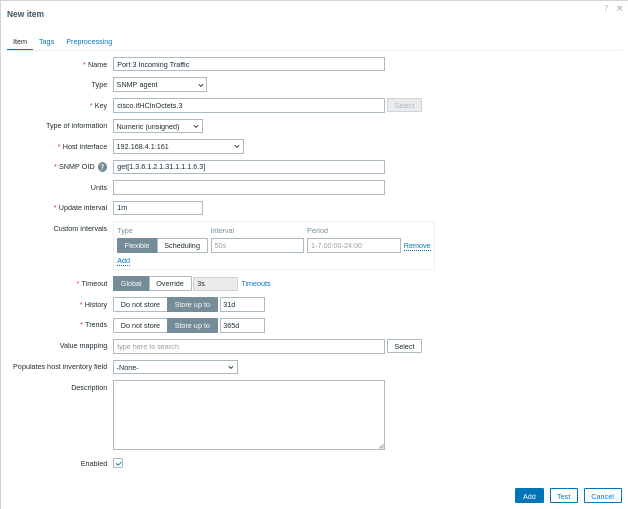
snmpget -v 2c -c <your_community_string> -On <device_IP> IF-MIB::ifHCInOctets.32. 创建SNMP 监控项:
- 导航至数据采集 > 主机,点击您的SNMP 主机的监控项选项卡,然后点击创建监控项。
- 名称:输入描述性名称(例如“端口3入站流量”)。
- 类型:选择SNMP agent。
- 键:提供有意义的键(例如
cisco.ifHCInOctets.3)。 - 主机接口:确保已选择SNMP接口。
-
SNMP OID:使用支持的格式输入OID,例如:
get[1.3.6.1.2.1.31.1.1.1.6.3]for a single value;walk[1.3.6.1.2.1.31.1.1.1.6.3]to retrieve a subtree of values asynchronously.
`get[1.3.6.1.2.1.31.1.1.1.6.3]``用于获取单个值;
walk[1.3.6.1.2.1.31.1.1.1.6.3]用于异步获取子树值。
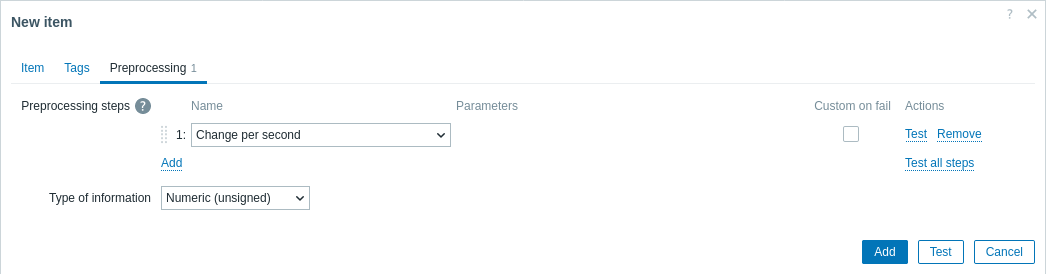
- 预处理(如需要):如果监控项返回累积计数器(如接口流量),导航至预处理选项卡,添加类似“每秒变化”的预处理步骤以计算速率。
要在单个SNMP事务中获取多个值,可以使用语法walk[OID1,OID2,...]指定多个OID。
在数字OID和MIB名称之间转换
在使用SNMP时,您可能需要在数字OID与其对应的MIB名称之间进行转换。 这种转换有助于更轻松地识别和排查指标问题。
- 将MIB名称转换为数字OID:使用带有
-On选项的snmptranslate命令。 例如,要将MIB名称IF-MIB::ifHCInOctets.3转换为其数字OID,run:
snmptranslate -On IF-MIB::ifHCInOctets.3该命令可能输出:
.1.3.6.1.2.1.31.1.1.1.6.3- 将数字OID转换回其MIB名称:使用带有
-IR(或-m ALL)选项的snmptranslate命令进行反向转换。 例如,要将数字OID.1.3.6.1.2.1.31.1.1.1.6.3转换回其MIB名称,run:
snmptranslate -IR -On .1.3.6.1.2.1.31.1.1.1.6.3该命令可能输出:
IF-MIB::ifHCInOctets.3设置问题告警
本指南提供了发送电子邮件警报的基本配置步骤。
- 导航到 User settings > Profile,切换到 媒介 标签页,然后单击 添加用户。

- 按照 Receiving a problem notification 的指南进行操作。
下次当 Zabbix 检测到问题时,您应该会通过电子邮件接收到警报。
测试配置
为确保 Zabbix 能正确检测网络性能 问题,可通过增加 ICMP ping 响应时间阈值来模拟真实问题。
1. 在 Zabbix 中打开你的 "Cisco Router" 主机 配置。
2. 转到 Macros 标签页,并选择 Inherited and 主机宏。
3. 找到 {$ICMP_RESPONSE_TIME_WARN} 宏(或类似的响应时间阈值宏)。
4. 设置一个非常低的值(例如 0.001),当 ping 响应时间超过该值时将触发告警。
5. 点击 Update 以应用更改。
6. 等待片刻,让 Zabbix 检测模拟的 问题。
7. 转到 Monitoring > Problems 以确认告警是否出现(例如,“High ICMP ping response time”)。
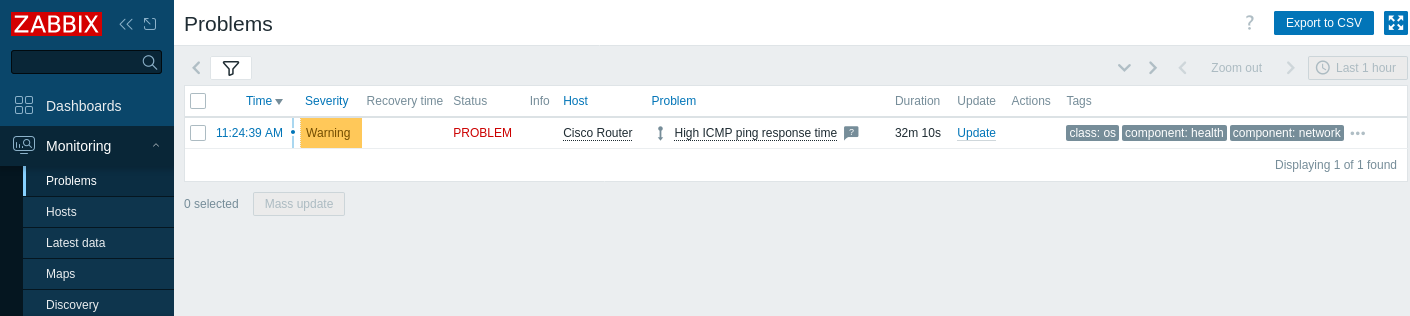
如果已配置告警,你也应当收到问题告警。
8. 将宏值恢复为原始设置,并点击 Update 保存更改。
9. 确认问题已解决,并且已从 Problems 部分消失。
SNMP监控故障排除
如果您发现Zabbix前端中的SNMP图标显示为红色或未收集到数据,请尝试以下步骤:
1. 检查SNMP连通性。
对于SNMPv2 run,从您的Zabbix server执行以下命令:
snmpwalk -v 2c -c <community_string> <device_IP> .该命令验证设备是否响应SNMP queries。
对于SNMPv3,需包含正确的SNMPv3凭据:
snmpwalk -v3 -u <your_user> -l authPriv -a MD5 -A <auth_password> -x AES -X <priv_password> <device_IP> .这将验证SNMPv3凭据是否正确以及设备是否安全响应。
2. 确保MIB文件已安装并启用,如前提条件所述。 要确认这一点,当您query网络设备时,以下命令不应报错:
snmpwalk -v 2c -c <your_community_string> <device_IP> ifInOctets该命令应返回翻译后的OID且无错误。
3. 确认Zabbix中配置的SNMP version和凭据与设备设置匹配。 例如,检查Zabbix 主机配置中的SNMP设置,并与设备配置进行比对。 在Cisco设备上,您可以通过运行以下命令查看SNMP设置:
show running-config | include snmp这确保团体字string(对于SNMPv2)或SNMPv3用户详细信息正确。
4. 验证网络设备上是否正确启用了SNMP。 在Cisco路由器上,登录控制台并run:
show running-config | include snmp该命令显示活动的SNMP配置,帮助确认SNMP是否正确配置。
5. 确保没有防火墙或网络问题阻止Zabbix server与设备之间的SNMP流量(通常在端口161)。 您可以使用以下命令测试连通性:
nc -zv <设备IP> 161
nc -zv检查设备上的161端口是否开放并监听。
此外,如果您在Ubuntu上使用UFW,检查防火墙状态:
sudo ufw status或对于iptables:
sudo iptables -L -n6. 查看Zabbix server日志文件中任何与SNMP相关的错误,以帮助定位问题:
tail -f /tmp/zabbix_server.logtail -f允许您实时监控日志更新。
参见:
- Creating an item - 学习如何添加额外的指标。
- SNMP agent - 有关使用 Zabbix 进行 SNMP 监控的更多信息。
- Standardized templates for network devices - 有关可用 SNMP 模板的信息。
- Discovery of SNMP OIDs - 有关交换机上 SNMP 自动发现的更多信息。
- Configuring a network discovery rule - 有关如何配置 Zabbix 用于发现 主机 和服务的网络发现规则的更多信息。