
- 10 Monitorar un commutador o un enrutador de xarxa amb Zabbix
10 Monitorar un commutador o un enrutador de xarxa amb Zabbix
Introducció
Aquesta guia us explica els passos necessaris per iniciar el control bàsic del vostre commutador de xarxa o encaminador amb Zabbix. S'utilitza un encaminador Cisco com a exemple, però el procediment s'aplica a qualsevol dispositiu de xarxa habilitat per SNMP.
Per a qui va aquesta guia
Aquesta guia està dissenyada per als nous usuaris de Zabbix i administradors de xarxa que volen activar ràpidament la supervisió bàsica dels dispositius de xarxa. Si necessiteu una personalització profunda o opcions de configuració avançades, consulteu la pàgina Agent SNMP o la secció Configuració del manual Zabbix.
Requisits previs
Abans de continuar amb aquesta guia, assegureu-vos que teniu:
- Servidor Zabbix i interfície Zabbix instal·lats: instal·leu segons les instruccions del vostre sistema operatiu (veieu Instal·lació des de paquets i Instal·lació de la interfície web).
- Dispositiu habilitat per SNMP: un commutador o enrutador de xarxa (per exemple, un enrutador Cisco) amb SNMP habilitat.
- Fitxers MIB instal·lats: La instal·lació de fitxers MIB permet a Zabbix traduir els OID numèrics en noms i descripcions llegibles per humans. Sense la compatibilitat adequada amb MIB, és possible que només veieu valors numèrics, cosa que dificulta la configuració d'elements i la resolució de problemes.
Per instal·lar fitxers MIB a Ubuntu:
1. Instal·leu el paquet de descàrrega MIB:
sudo apt-get update
sudo apt-get install snmp-mibs-downloader
Si necessiteu afegir MIB específics del proveïdor (per exemple, de Cisco, Juniper), poseu-los al directori MIB adequat:
- Per a sistemes basats en Linux, les ubicacions habituals inclouen /usr/share/snmp/mibs/ o /usr/local/share/snmp/mibs/.
- Per a instal·lacions de Zabbix, els fitxers MIB es poden emmagatzemar a /var/lib/zabbix/mibs/.
Assegureu-vos que la variable d'entorn MIBDIRS o el fitxer snmp.conf inclogui la ruta correcta.
Per verificar que el vostre sistema reconeix els nous MIB, utilitzeu:
snmptranslate -IR -On <NOM-MIB>::<objecte>Per obtindre instruccions detallades, consulteu la documentació de la vostra biblioteca SNMP:
-
Editeu
/etc/snmp/snmp.confi comenteu la línia que comença ambmibs :per permetre que el sistema carregui tots els MIB disponibles. -
Verifiqueu executant un
snmpwalk(per exemple,snmpwalk -v 2c -c <cadena_de_la_vostra_comunitat> <IP_del_dispositiu>) i comproveu que els OID es mostren amb noms descriptius.
Aquesta guia es basa en la configuració següent:
- Versió Zabbix: 7.0 (instal·lada des de paquets)
- Distribució del sistema operatiu: Ubuntu
- Versió del sistema operatiu: 24.04.2+
- Components Zabbix: servidor, interfície i, opcionalment, agent (si es monitoren les mètriques de la xarxa local)
- Base de dades: MySQL
- Servidor web: Apache
- Dispositiu de xarxa: Cisco Catalyst 3750V2-24FS
Se suposa que el vostre dispositiu de xarxa ja és instal·lat i connectat físicament.
Configurar el dispositiu de xarxa (exemple d'enrutador Cisco)
Per al monitoratge mitjançant SNMP, heu de configurar el vostre dispositiu de xarxa per permetre consultes SNMP. L'exemple següent és per a SNMPv2 i no té en compte la configuració existent. Precaució: l'aplicació d'aquestes ordres pot anul·lar les configuracions SNMP actuals.
Per a un enrutador Cisco, la configuració normalment inclou les passes escrites tot seguit.
Exemple SNMPv2
1. Habilitar SNMP i configurar la cadena de comunitat.
Inicieu la sessió’ al vostre moder de configuració de Cisco i a la vostra configuració de Cisco:
configure terminalTot seguit, habiliteu SNMP especificant una cadena de comunitat de només lectura. Per exemple:
community snmp-server <your_community_string> ROSubstituïu <your_community_string> per la vostra cadena de comunitat segura. Nota: l'opció RO (només de lectura) permet que SNMP recuperi dades del dispositiu, però evita qualsevol canvi de configuració.
Es recomana restringir l'accés SNMP només als dispositius necessaris per motius de seguretat. Per obtindre més informació sobre la configuració de llistes de control d'accés (ACL), consulteu oficial de Cisco documentació.
2. Desar la configuració.
Deseu els vostres canvis per assegurar-vos que la configuració SNMP persisteixi després d'un reinici:
write memoryExemple SNMPv3
SNMPv3 proporciona una seguretat millorada amb autenticació i xifrat. La seva configuració és més segura que SNMPv2 i s'ha de verificar amb la documentació específica del dispositiu.
1. Creeu un grup SNMP.
Configureu un grup SNMPv3 amb privadesa (xifrat) habilitat:
    configure terminal
    snmp-server group <el_vostre_grup> v3 priv
2. Creeu un usuari SNMP: Afegiu un usuari SNMPv3 amb autenticació i privadesa. Substituïu els marcadors de posició pels valors desitjats:
snmp-server user <your_user> <your_group> v3 auth md5 <auth_password> priv aes 128 <priv_password>3. Deseu la configuració:
write memoryPer obtenir més detalls o instruccions específiques del model, podeu consultar els [tutorials de configuració de Cisco SNMP] externs (https://www.cisco.com/c/en/us/td/docs/ios-xml/ios/snmp/configuration/xe-16/snmp-xe-16-book/nm-snmp-cfg-snmp-support.html). Aquesta guia, però, ofereix les passes bàsiques per habilitar el monitoratge SNMP.
Configurar la interfície Zabbix
Creeu un equip a la interfície Zabbix
1. Inicieu sessió a la interfície de Zabbix.
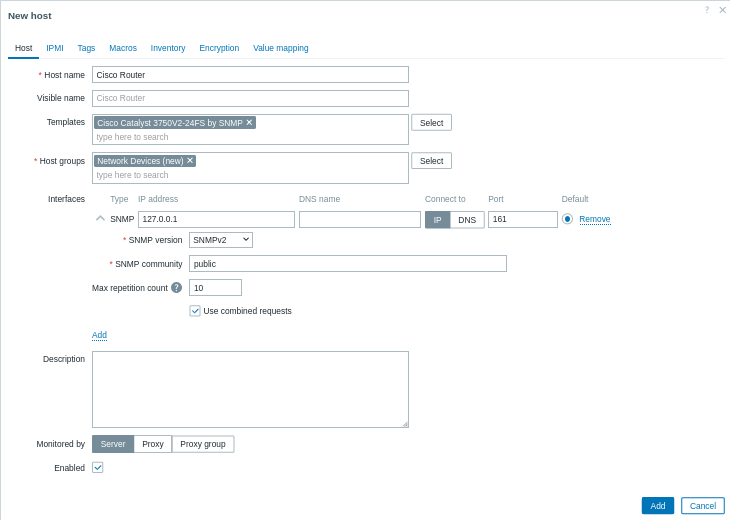
2. Afegeix un equip nou.
Aneu a Recull de dades > Equips i feu clic a Crea equip.
- Nom d'equip: introduïu un nom per al vostre dispositiu (p. ex., "Encaminador Cisco").
- Grups d'equips: trieu un grup existent o creeu-ne un de nou, com ara "Dispositius de xarxa".
- Interfícies:
- Feu clic a Afegir a Interfícies.
- Trieu SNMP com a tipus d'interfície.
- Introduïu l'adreça IP o el nom DNS del vostre encaminador Cisco.
- Establiu el port SNMP predeterminat (normalment 161).
- Utilitzeu el menú desplegable per triar la versió SNMP adequada (per exemple, SNMPv2).
- Per a SNMPv1/v2, introduïu la cadena de comunitat al camp Comunitat SNMP. Per a SNMPv3, es demanaran credencials addicionals (Nom del context, Nom de la seguretat i Nivell de seguretat).
3. Plantilles d'enllaç
Al camp Plantilles, trieu la plantilla SNMP que millor s'adapti al vostre dispositiu. Zabbix ofereix una gamma de plantilles SNMP preconfigurades per a moltes famílies de dispositius. Per exemple, si sou monitorant un dispositiu Cisco, trieu la plantilla que correspongui al sistema operatiu o al model del vostre dispositiu (com ara Cisco IOS SNMP o Cisco Catalyst 3750<device model> SNMP).
4. Feu clic a Afegir per desar l'equip.

Veure les mètriques recollides
Felicitats! Zabbix ara és configurat per monitorar el vostre dispositiu de xarxa.
Darreres dades:
- Navegueu a Monitoratge > Dades més recents a la interfície de Zabbix.
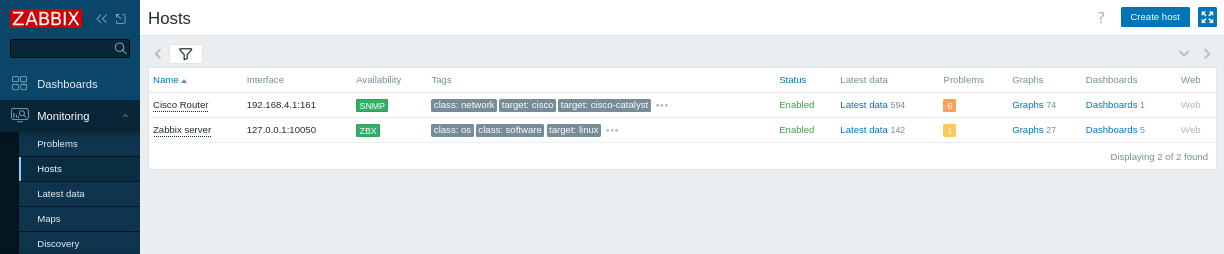
- Trieu el vostre equip "Enrutador Cisco" (o equips trobats) per veure mètriques com ara el temps de funcionament del maquinari i de la xarxa, la pèrdua d'ICMP, el ping i el temps de resposta, etc.
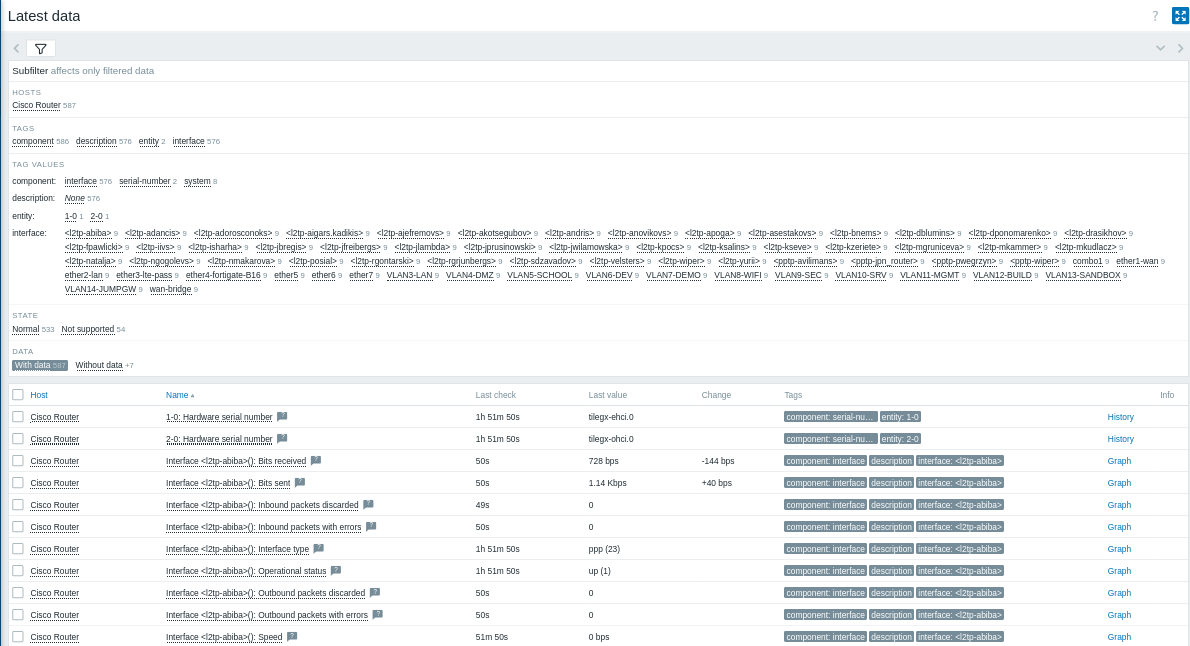
- Gràfics i pantalles:
Per veure les dades de rendiment, feu clic a Gràfics al costat dels elements SNMP per veure mètriques detallades.
Com a pas següent, podeu:
- Afegir elements SNMP personalitzats per monitorar mètriques addicionals.
- Configurar alertes de problemes per rebre notificacions sobre possibles problemes.
Crear elements SNMP
Un cop configurat l'equip, podeu crear elements per monitorar mètriques específiques. Nota: aquesta passa és opcional si feu servir una plantilla, ja que les plantilles ja contenen conjunts d'elements predeterminats.
1. Identifiqueu l'OID SNMP:
Empreu l'ordre snmpwalk per llistar els OID disponibles al vostre dispositiu. Per exemple:
snmpwalk -v 2c -c públic <IP_dispositiu> .Cerqueu l'OID de la mètrica que voleu monitorar (per exemple, IF-MIB::ifHCInOctets.3 per al trànsit entrant al port 3). Per obtindre l'OID numèric, podeu emprar :
snmpget -v 2c -c public -On <dispositiu_IP> IF-MIB::ifHCInOctets.32. Creeu un element SNMP:
- Navegueu a Recull de dades > Equips i feu clic a la pestanya Elements del vostre equip SNMP i feu clic a Crear element.
- Nom: introduïu un nom descriptiu (p. ex., "Tràfic entrant del port 3").
- Tipus: trieu agent SNMP.
- Clau: proporciona una clau significativa (p. ex.,
cisco.ifHCInOctets.3). - Interfície de l'equip: assegureu-vos que la interfície SNMP estigui seleccionada.
- SNMP OID: introduïu l'OID emprant un dels formats admesos, per exemple:
get[1.3.6.1.2.1.31.1.1.1.6.3]per a un sol valor;walk[1.3.6.1.2.1.31.1.1.1.6.3]per recuperar un subarbre de valors de manera asíncrona.
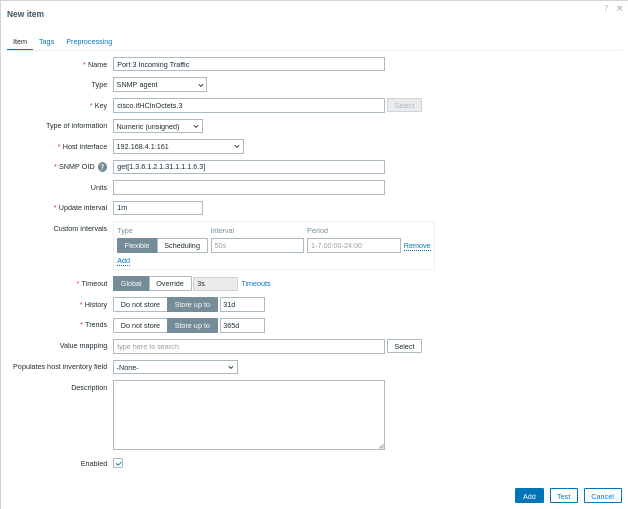
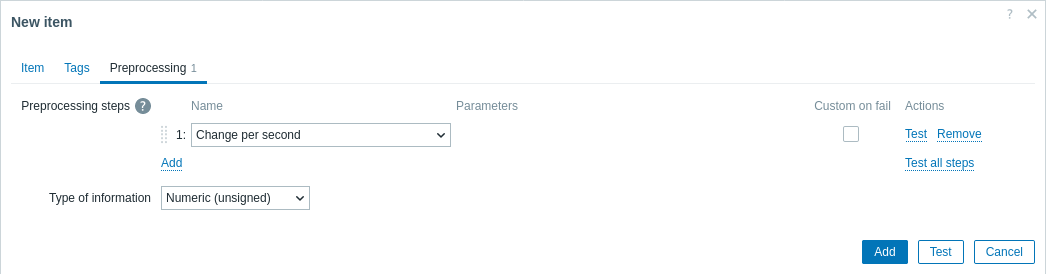
- Preprocessament (si cal): si l'element retorna un comptador acumulat (com ara el trànsit d'interfície), navegueu a la pestanya Preprocessament i afegiu una passa de preprocessament com ara "Canvi per segon" per calcular la taxa.
Per recuperar diversos valors en una transacció SNMP, podeu especificar diversos OID mitjançant la sintaxi walk[OID1,OID2,...].
Traduir OID entre noms numèrics i MIB
Quan treballeu amb SNMP, potser haureu de convertir entre OID numèrics i els seus noms MIB corresponents. Aquesta traducció ajuda a identificar i solucionar problemes més fàcilment.
- Traduir un nom MIB a un OID numèric: utilitzeu l'ordre
snmptranslateamb l'opció-On. Per exemple, per traduir el nom de MIBIF-MIB::ifHCInOctets.3al seu OID numèric, executeu:
snmptranslate -On IF-MIB::ifHCInOctets.3Aquesta comanda pot retornar:
.1.3.6.1.2.1.31.1.1.1.6.3- Traduir un OID numèric al seu nom MIB: utilitzeu l'ordre
snmptranslateamb l'opció-IR(o-m ALL) per revertir la traducció. Per exemple, per traduir l'OID numèric.1.3.6.1.2.1.31.1.1.1.6.3al seu nom MIB, executeu:
snmptranslate -IR -On .1.3.6.1.2.1.31.1.1.1.6.3Aquesta comanda pot retornar:
IF-MIB::ifHCInOctets.3Configurant les alertes de problemes
Aquesta guia us dona passes de configuració bàsica per enviar alertes per correu-e.
1. Aneu a Configuració de l'usuari > Perfil, canvieu a la pestanya Suport i afegiu el vostre correu electrònic.

2. Seguiu la guia per a Rebre una notificació de problema.
El proper cop, quan Zabbix detecti un problema, hauríeu de rebre una alerta per correu electrònic.
Provar la configuració
Per garantir que Zabbix detecti correctament els problemes de rendiment de la xarxa, simuleu un problema real pujant el llindar del temps de resposta de ping ICMP.
1. Obriu la configuració de l'equip "Cisco Router" a Zabbix.
2. Aneu a la pestanya Macros i trieu Macros heretades i hostes.
3. Localitzeu la macro {$ICMP_RESPONSE_TIME_WARN} (o una macro de llindar de temps de resposta similar).
4. Establiu un valor molt baix (p. ex., 0,001) per activar una alerta quan la resposta de ping superi aquest valor.
5. Feu clic a Actualitzar per aplicar els canvis.
6. Espereu uns moments perquè Zabbix detecti el problema simulat.
7. Aneu a Monitoratge > Problemes per verificar que apareix una alerta (p. ex., "Temps de resposta de ping ICMP alt").
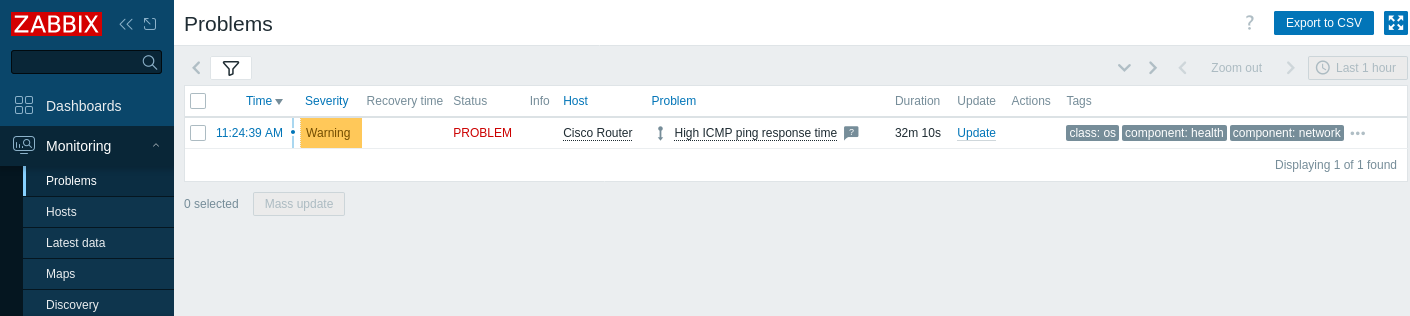
Si les alertes són configurades, també hauríeu de rebre una alerta de problema.
8. Revertiu el valor de la macro a la seva configuració original i feu clic a Actualitzar per desar els canvis.
9. Confirmeu que el problema s'ha resolt i desapareix de la secció Problemes.
Resolució de problemes de monitoratge SNMP
Si observeu que la icona SNMP a la interfície de Zabbix apareix en VERMELL o no es recullen dades, proveu les passes següents:
1. Comproveu la connectivitat SNMP.
Per a SNMPv2, executeu l'ordre següent des del vostre servidor Zabbix:
snmpwalk -v 2c -c <cadena_comunitat> <IP_dispositiu> .Aquesta ordre verifica que el dispositiu respon a les consultes SNMP.
Per a SNMPv3, incloeu les credencials SNMPv3 adequades:
snmpwalk -v3 -u <el vostre_usuari> -l authPriv -a MD5 -A <contrasenya_autenticació> -x AES -X <contrasenya_priv> <IP_dispositiu> .Això verifica que les credencials SNMPv3 siguin correctes i que el dispositiu respon de manera segura.
2. Assegureu-vos que els fitxers MIB estiguin instal·lats i habilitats tal com es descriu a prerequisits. Per garantir-ho, l'ordre següent no ha de donar error quan consulteu un dispositiu de xarxa:
snmpwalk -v 2c -c <cadena_de_vostra_comunitat> <IP_dispositiu> ifInOctetsAixò hauria de tornar OID traduïts sense errors.
3. Confirmeu que la versió SNMP i les credencials configurades a Zabbix coincideixen amb les establertes al vostre dispositiu. Per exemple, reviseu la configuració SNMP a la configuració de l'amfitrió Zabbix i verifiqueu-les amb la configuració del vostre dispositiu. En un dispositiu Cisco, podeu comprovar la configuració SNMP executant:
show running-config | include snmpAixò garanteix que la cadena de comunitat (per a SNMPv2) o els detalls de l'usuari SNMPv3 siguin correctes.
4. Verifiqueu que SNMP estigui habilitat correctament al vostre dispositiu de xarxa. En un enrutador Cisco, inicieu sessió a la consola i executeu:
show running-config | include snmpAquesta comanda mostra la configuració SNMP activa i ajuda a confirmar que SNMP està configurat correctament.
5. Assegureu-vos que cap tallafocs o problemes de xarxa bloquegin el trànsit SNMP (normalment al port 161) entre el servidor Zabbix i el dispositiu. Podeu provar la connectivitat mitjançant:
nc -zv <IP_dispositiu> 161
nc -zv comprova si el port 161 és obert i escoltant al dispositiu.
A més, si utilitzeu UFW a Ubuntu, comproveu l'estat del tallafoc:
sudo ufw statusO, per a iptables:
sudo iptables -L -n6. Reviseu els fitxers de registre del servidor Zabbix per detectar qualsevol error relacionat amb SNMP per ajudar a identificar el problema:
tail -f /tmp/zabbix_server.logtail -f us permet controlar les actualitzacions del registre en temps real.
Veure també:
- Creació d'un element: aprèn a afegir mètriques addicionals.
- Agent SNMP - informació addicional sobre la supervisió SNMP amb Zabbix.
- Plantilles estandarditzades per a dispositius de xarxa - informació sobre les plantilles SNMP disponibles.
- Descoberta dels OID SNMP - informació addicional sobre la descoberta d'SNMP en un commutador.
- Configuració d'una regla de descoberta de xarxa - informació addicional sobre com configurar una regla de descoberta de xarxa utilitzada per Zabbix per trobar equips i serveis.