Table of Contents
3 Graphs
Overview
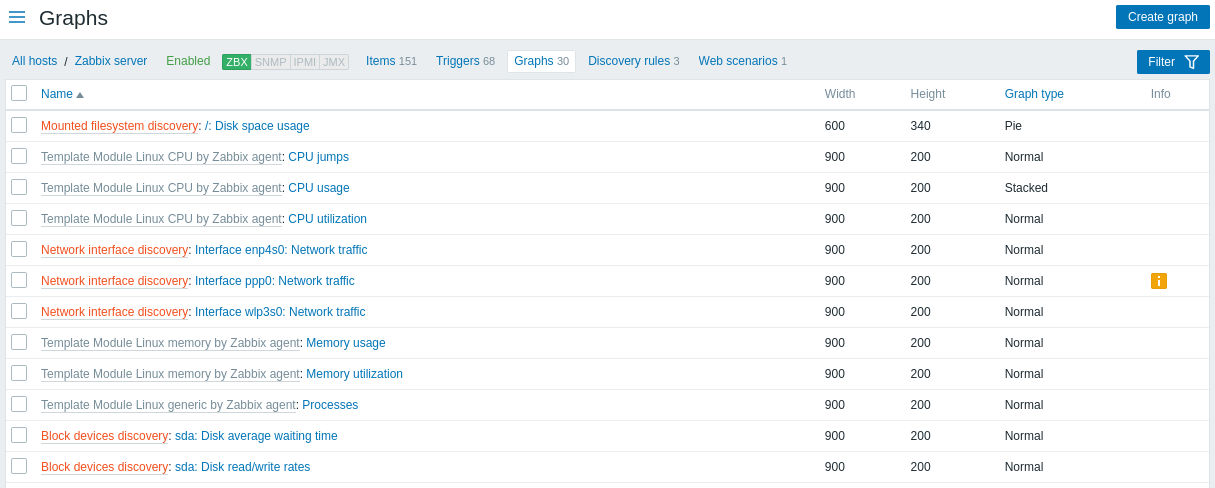
The custom graph list for a host can be accessed from Configuration → Hosts by clicking on Graphs for the respective host.
A list of existing graphs is displayed.

Displayed data:
| Column | Description |
|---|---|
| Name | Name of the custom graph, displayed as a blue link to graph details. Clicking on the graph name link opens the graph configuration form. If the host graph belongs to a template, the template name is displayed before the graph name, as a gray link. Clicking on the template link will open the graph list on the template level. If the graph has been created from a graph prototype, its name is preceded by the low-level discovery rule name, in orange. Clicking on the discovery rule name will open the graph prototype list. |
| Width | Graph width is displayed. |
| Height | Graph height is displayed. |
| Graph type | Graph type is displayed - Normal, Stacked, Pie or Exploded. |
| Info | If the graph is working correctly, no icon is displayed in this column. In case of errors, a square icon with the letter "i" is displayed. Hover over the icon to see a tooltip with the error description. |
To configure a new graph, click on the Create graph button at the top right corner.
Mass editing options
Buttons below the list offer some mass-editing options:
- Copy - copy the graphs to other hosts or templates
- Delete - delete the graphs
To use these options, mark the checkboxes before the respective graphs, then click on the required button.
Using filter
You can filter graphs by host group and host. For better search performance, data is searched with macros unresolved.
© 2001-2025 by Zabbix SIA. All rights reserved.
Except where otherwise noted, Zabbix Documentation is licensed under the following license
