- - #5 What's new in Zabbix 3.2.0
- - Event correlation
- - Event tags for greater flexibility
- - View problems more clearly
- - Close problems manually
- - Ability to customize macro values
- - Nested representation of host groups
- - Coping with fast-growing log files
- - Easier trigger hysteresis
- - Recovery operations
- - Delaying escalations during maintenance
- - Viewable items, triggers, graphs created by LLD
- - Web scenario export/import
- - Frontend improvements
- - Daemon changes/improvements
- #5 What's new in Zabbix 3.2.0
- Event correlation
With the introduction of event tags, it is now possible to tag problem events. That also means that with tagging it is possible to correlate a specific problem event to its resolution. For example, in log monitoring, when several problems are discovered that are related to different applications, you may want to see them resolved separately rather than all together. This is now possible.
For example, in log monitoring you encounter lines similar to these:
Line1: Application 1 stopped
Line2: Application 2 stopped
Line3: Application 1 was restarted
Line4: Application 2 was restarted
With event correlation, you can match the problem event from Line1 to the resolution from Line3 and the problem event from Line2 to the resolution from Line4, and close these problems one by one:
Line1: Application 1 stopped
Line3: Application 1 was restarted #problem from Line 1 closed

Line2: Application 2 stopped
Line4: Application 2 was restarted #problem from Line 2 closed
For more information see the event correlation section.
- Event tags for greater flexibility
Custom tags for events are introduced in the new version. Custom event tags are realized as a pair of the tag name and value. You can use only the name or pair it with a value.
These tags are defined in trigger configuration - for triggers, template triggers and trigger prototypes.
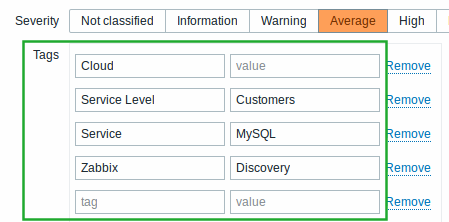
After the tags are defined on the trigger level, corresponding events get marked with tag data.
Having custom tags for events opens up new possibilities:
- it is possible to tag events and correlate them
- tag data is visible in Monitoring → Problems
- tag-based filtering is available for actions. You can get notified only on events matched by the tag/tag value.
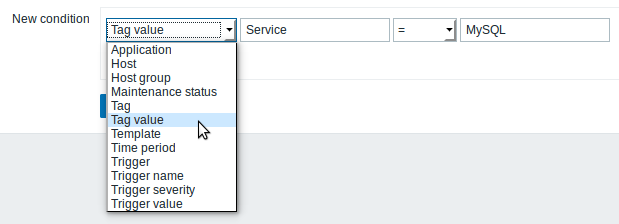
Tags can be defined for template triggers and trigger prototypes. These tags are propagated to real triggers when created.
For more information see the event tag section.
- View problems more clearly
The monitoring part of Zabbix frontend has gained a new dedicated "Problems" view. This section is for displaying problems only and it follows immediately after Monitoring → Dashboard. The new section is intended to give users a much clearer view of problems in comparison to the two Monitoring → Triggers and Monitoring → Events sections used for this purpose previously.
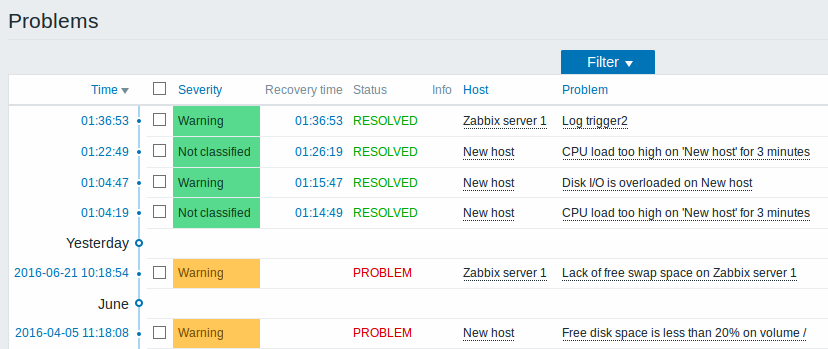
In a related development, Monitoring → Events has been removed from the frontend. To access event details, use the new section for problems.
- Close problems manually
Some problems in log monitoring or trap handling need to be closed manually because there is no easy way to determine when the problem has been resolved. For these cases, triggers can now be configured with the option of manual closing of problem events. Once configured, problem events of the trigger can be closed manually when using the acknowledgement screen.
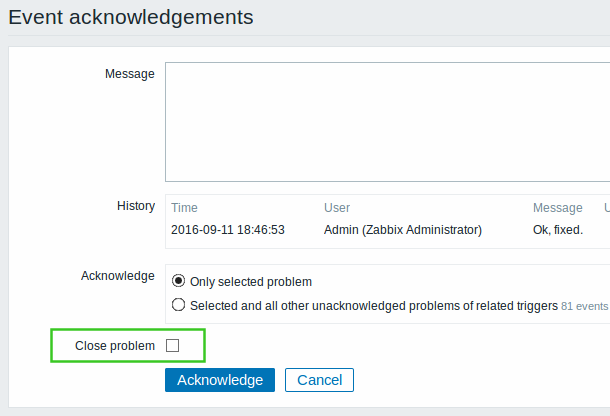
For more information see: Manual closing of problems.
- Ability to customize macro values
Sometimes a macro may resolve to a value that is not necessarily easy to work with. It may be long or contain a specific substring of interest that you would like to extract. For these purposes, the new version comes with a new concept of macro functions. Currently, two macro functions are supported:
- regsub - substring extraction by a regular expression match (case sensitive)
- iregsub - substring extraction by a regular expression match (case insensitive)
These macro functions are supported for the {ITEM.VALUE} and {ITEM.LASTVALUE} macro values in trigger names, trigger descriptions, event tags, notifications subjects and notification messages.
For more information see the macro function section.
- Nested representation of host groups
Having a built-in mechanism for a logical grouping of host groups is something that is very much required, especially in larger organizations. While the new Zabbix version does not support a full nesting of host groups where a higher-level host group would automatically inherit all hosts of a nested host group, first steps towards nested host groups have been taken by allowing a nested representation of host groups and aligning the permission schema to host group nesting.
Nested representation of host groups is accomplished by using the '/' forward slash to separate the logical levels of host groups.

For more information see: Configuring a host group
Note that nested host group functionality is extended in Zabbix 3.2.2.
In a related development, the host group permission tab has been significantly reworked in user group and user configuration forms.
- Coping with fast-growing log files
More advanced options are available for dealing with fast-growing log files. The key issue with such files is the enormous number of messages, which are written to the log files in certain situations. As all new lines must be analyzed by Zabbix and the matching lines sent to Zabbix server, it may result both in serious delays and a large number of identical messages sent and stored in the database.
To deal with these issues there are two major improvements:
- an optional maxdelay parameter for log monitoring items, which can be used to set a time bracket that log records must be analyzed within - if it's impossible to analyze all records within the set time, older lines are skipped in favour of analyzing the more recent ones.
<!-- -->- log.count and logrt.count - two new agent items that count the number of matched lines and return that number instead of the lines themselves.
- Easier trigger hysteresis
Trigger hysteresis is a useful option both to avoid trigger "flapping" (switching between problem and OK too often) and in situations where you need an interval between the problem value and the OK value. While it was possible in previous Zabbix versions to define trigger hysteresis using the {TRIGGER.VALUE} macro, the resulting expression was not exactly the easiest way of doing things:
({TRIGGER.VALUE}=0 and {server:temp.last()}>20) or
({TRIGGER.VALUE}=1 and {server:temp.last()}>15)
The new version proposes a much easier way of defining trigger hysteresis by introducing an optional second trigger expression called 'recovery expression' where you can separately define the conditions that have to be met for the trigger to return back to the OK state.
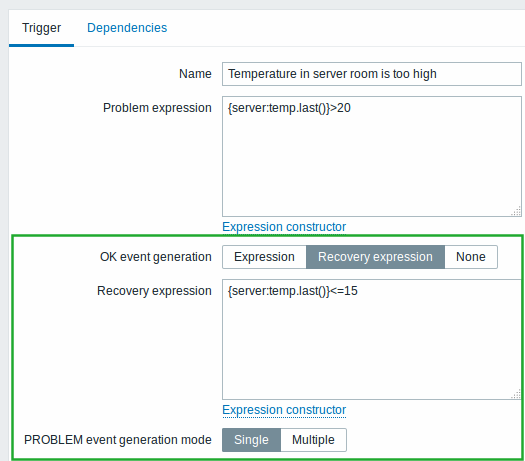
There is also more control over how OK events are generated. You can use the problem expression as basis (then it works the same way as before), the recovery expression as basis, or even select 'None' in which case the trigger will always remain in problem state if it goes into it.
Additionally, PROBLEM event generation mode for single/multiple problem events has been changed from a silent default/optional checkbox into an obvious two-way choice.
See also:
- Recovery operations
Being notified on problem recovery has become easier in Zabbix. If previously there was the slightly confusing concept of a special "Recovery message" or the possibility to create a full escalation when problem triggers go OK, now that has been united into one "Recovery operation" concept.
In a recovery operation you can both receive a notification and execute a remote command. Even though recovery messages cannot be escalated (assigned to several steps), it is possible to assign several operations to a single step. Moreover, all users that were notified on the problem previously, can be notified on the recovery with just one selection made in action configuration.
Recovery operations also get a dedicated tab in the action configuration form, while the condition tab has been dropped and conditions now can be set in the general action property tab.
Note that some action conditions have been dropped completely with this development:
- "Trigger value" conditions for trigger events
- "Event type" conditions for internal events - Item in “normal” state, Low-level discovery rule in “normal” state, Trigger in “normal” state
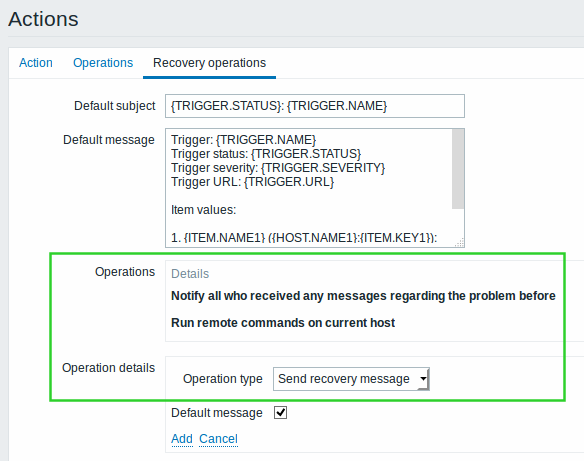
For more details, see:
- Delaying escalations during maintenance
The logic of delaying problem notifications during host maintenance has been changed.
In previous Zabbix versions, it was possible to skip problem notifications during a host maintenance period (using the Maintenance status = not in "maintenance" action condition). Then, if the problem persisted, problem events were generated immediately after the maintenance. However, since the original problem messages were suppressed, it was not always easy for users to understand what generated those events and why. Acknowledgement information of the original event was also lost.
In the new version, the old mechanism is dropped. Instead there is a new option in action configuration, which allows to pause notifications in the host maintenance phase if you wish so.
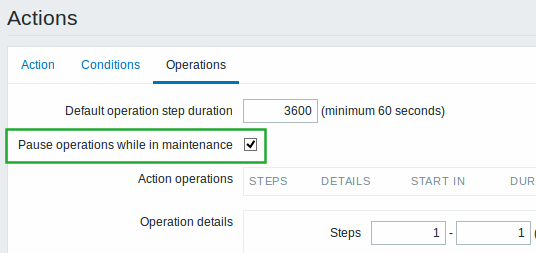
If notifications are paused during maintenance, they get started after the maintenance, according to the escalation scenario. That means that no messages are skipped, simply delayed.
See also:
- Viewable items, triggers, graphs created by LLD
Entities created by low-level discovery (items, triggers, graphs) in previous Zabbix versions were only listed. It was not possible to view their details or apply mass operations to them, such as enabling/disabling or deleting.
Now these entities are shown in a much more user-friendly way. It is possible to view the details of these items, triggers and graphs. Check-boxes are enabled to apply mass operations to them. Thus it is possible to enable/disable/delete them.
 |
Items created by low-level discovery before 3.2.0. |
 |
Items created by low-level discovery in 3.2.0. |
- Web scenario export/import
When exporting hosts or templates into XML, web scenarios are now exported as well. When importing hosts/templates, there are options for creating new, updating existing and deleting missing web scenarios.
Now on you may easily share web scenarios on share.zabbix.com. For example, export a template with the web scenarios into XML and upload to share.zabbix.com. Then others can download the template and import the XML into Zabbix.
- Frontend improvements
- Acknowledgement of OK events removed
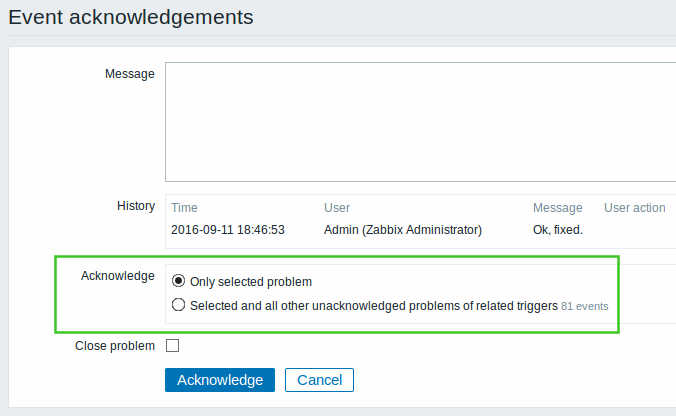
A separate option for acknowledging OK events along with problem events has been removed from the acknowledgement screen. It is now possible to acknowledge problem events only, with the choice of acknowledging just one or all problem events of the trigger(s).
- Several new filters
- Filtering by name
Host groups, templates and global scripts can now be searched by name in:
- Configuration → Host groups
- Configuration → Templates
- Administration → Scripts

- Filtering by name and status
Several frontend sections have gained a filter allowing to search by name as well as status, type or mode:
- Configuration → Maintenance
- Configuration → Actions
- Configuration → Discovery
- Administration → Proxies
- Administration → User groups
- Administration → Users
- Administration → Media types

- Updated translations
- Chinese (China)
- Czech
- English (United States)
- French
- Georgian
- German
- Italian
- Japanese
- Korean
- Polish
- Portuguese (Brazil)
- Russian
- Slovak
- Spanish
- Turkish
- Ukrainian
- Daemon changes/improvements
- Host availability, discovery, auto-registration and history data validation
Zabbix server will validate host availability, discovery and auto-registration data received from proxy stricter and will reject the whole data packet in case it contains invalid entries. At the same time fewer but more informative messages will be written to the log file. Also, if passive proxy for example returns invalid host availability data, server will skip polling discovery, history and auto-registration data from that proxy. Apart from better messages processing of historical data from proxies and active agents is not affected. Log file messages containing name, IP address and error description will help troubleshooting misconfiguration issues such as proxypoller connecting server's trapper port or agent instead of proxy.
- Configuration parameters
Flexible item key parameters for alias in agent configuration
Zabbix agent configuration file
parameter Alias now supports setting flexible key parameters. For
instance, now it is possible to set an alias with wildcard as a
parameter (alias[*]) and use it on item setup entering required valid
key parameters as usual (e.g., alias[all,avg5]). The other benefit of
such flexibility is that now it is possible to pass any parameters to a
key which originally doesn't support parameters. In such case passed
parameters will be ignored and original key processed. This may be used
setting up multiple low-level discovery
rules
for the same items.
- Item changes/improvements
log.count and logrt.count - two new items have been added along with a 'maxdelay' parameter for log monitoring. For more information see: Coping with fast-growing log files.
- VMware monitoring improvements
Two new item keys to read the datacenter name have been added for hypervisors and virtual machines:
vmware.hv.datacenter.name[<url>,<uuid>]vmware.vm.datacenter.name[<url>,<uuid>]
A {#DATACENTER.NAME} field has been added to the hypervisor and
virtual machine discovery item keys vmware.hv.discovery and
vmware.vm.discovery.
- Trigger functions
The count() function now supports regexp and iregexp operators for all item types. It is now possible to count values matching a regular expression (ordinary or global) collected over a specified period of time.
Several functions are now calculated for unsupported items as well:
- nodata()
- date()
- dayofmonth()
- dayofweek()
- now()
- time()
Host and item, however, must be enabled as before.
- Unsupported items and unknown values in triggers/calculated items
Previously any unsupported item in trigger expression or error in function evaluation immediately rendered the whole expression value to Unknown. Triggers became Unknown, calculated items became unsupported.
In the new version there's a more flexible approach: unsupported items and errors in function evaluation continue to take part in expression evaluation as unknowns.
Advantage - logical OR and AND expressions are evaluated, if possible, to known values. For example:
- '1 or Unsuported_item1.some_function()' is evaluated to '1' (True)
- '0 and Unsuported_item1.some_function()' is evaluated to '0' (False)
See Expressions with unsupported items and unknown values.
- Miscellaneous improvements
- Database changes
The history_text.id and history_log.id fields were removed from the corresponding history tables. Those fields were redundant and removing them will simplify history table structures and will remove unnecessary overhead when inserting values.

