Is this not what you were looking for? Switch to the current version or choose one from the drop-down menu.
10. Maintenance
Overview
You can define maintenance periods for hosts and host groups in Zabbix. There are two maintenance types - with data collection and with no data collection.
During a maintenance "with data collection" triggers are processed as usual and events are created when required. To skip receiving notifications during such maintenance type, actions should be configured by retaining the default action condition 'Maintenance status = not in "maintenance"' - then you should not get notifications during maintenance. It's dedicated to skip problem notifications.
If a trigger generated an event during the maintenance period (as set in maintenance configuration), an additional event (the same as last event created during maintenance) will be created at the end of maintenance for the host. This way, if a problem happens during maintenance and is not resolved, a notification may be generated after the maintenance period ends.
To receive a notification during the maintenance you have to remove the default action condition about not taking actions during maintenance.
If at least one host (used in the trigger expression) is not in maintenance mode, Zabbix will send a problem notification.
Zabbix server must be running during maintenance. Timer processes are responsible for switching host status to/from maintenance at 0 seconds of every minute. A proxy will always collect data regardless of the maintenance type (including "no data" maintenance). The data is later ignored by the server if 'no data collection' is set.
When "no data" maintenance ends, triggers using nodata() function will not fire before the next check during the period they are checking.
If a log item is added while a host is in maintenance and the maintenance ends, only new logfile entries since the end of the maintenance will be gathered.
To ensure predictable behaviour of recurring maintenance periods (daily, weekly, monthly), it is required to use a common timezone for all parts of Zabbix.
Configuration
To configure a maintenance period:
- Go to: Configuration → Maintenance
- Click on Create maintenance period (or on the name of an existing maintenance period)
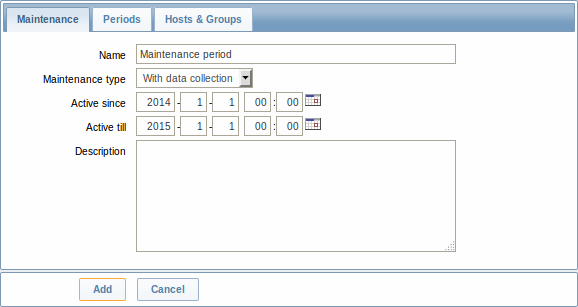
The Maintenance tab contains general maintenance period attributes:

| Parameter | Description |
|---|---|
| Name | Name of the maintenance period. |
| Maintenance type | Two types of maintenance can be set: With data collection - data will be collected by the server during maintenance, triggers will be processed No data collection - data will not be collected by the server during maintenance |
| Active since | The date and time when executing maintenance periods becomes active. Note: Setting this time alone does not activate a maintenance period; for that go to the Periods tab. |
| Active till | The date and time when executing maintenance periods stops being active. |
| Description | Description of maintenance period. |
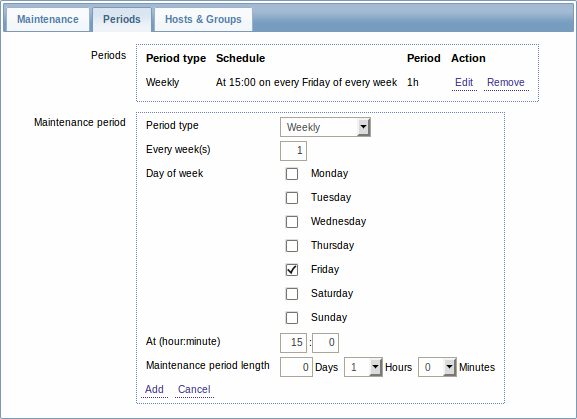
The Periods tab allows you to define the exact days and hours when the maintenance takes place. Clicking on New opens a flexible Maintenance period form where you can define the times - for daily, weekly, monthly or one-time maintenance.

Daily and weekly periods have an Every day/Every week parameter, which defaults to 1. Setting it to 2 would make the maintenance take place every two days or every two weeks and so on. The starting day or week is the day or week that Active since time falls on.
For example, having Active since set to 2013-09-06 12:00 and an hour long daily recurrent period every two days at 23:00 will result in the first maintenance period starting on 2013-09-06 at 23:00, while the second maintenance period will start on 2013-09-08 at 23:00. Or, with the same Active since time and an hour long daily recurrent period every two days at 01:00, the first maintenance period will start on 2013-09-08 at 01:00, and the second maintenance period on 2013-09-10 at 01:00.
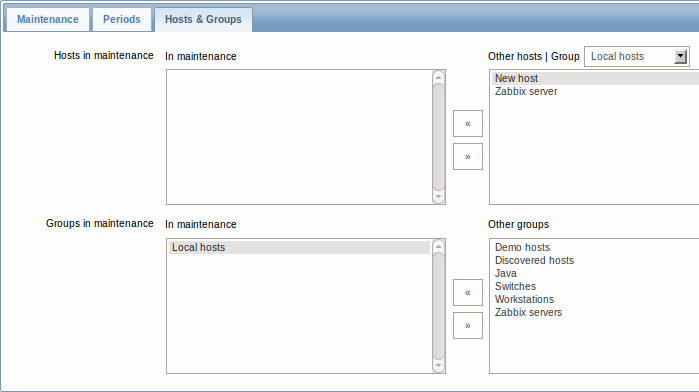
The Hosts & Groups tab allows you to select the hosts and host groups for maintenance.

Display
A round orange icon with a white wrench indicates that a host is in maintenance in the Monitoring → Dashboard, Monitoring → Triggers and Inventory → Hosts → Host inventory details sections.
![]()
Maintenance details are displayed when the mouse pointer is positioned over the icon.
The display of hosts in maintenance in the Dashboard can be unset altogether with the dashboard filtering function.
Additionally, hosts in maintenance get an orange background in Monitoring → Maps and in Configuration → Hosts their status is displayed as 'In maintenance'.
