Is this not what you were looking for? Switch to the current version or choose one from the drop-down menu.
3 Hosts
Overview
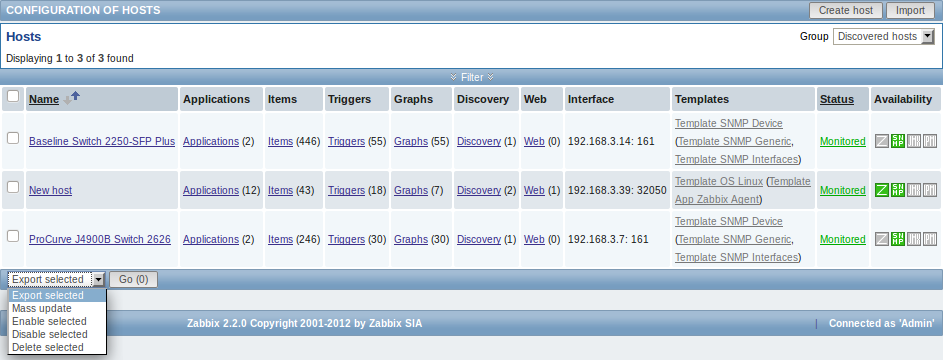
In the Configuration → Hosts section users can configure and maintain hosts.
A listing of existing hosts with their details is displayed.
From the dropdown to the right in the Hosts bar you can choose whether to display all hosts or only those belonging to one particular group.

Displayed data:
| Column | Description |
|---|---|
| Name | Name of the host. Clicking on the host name opens the host configuration form. |
| Elements (Applications, Items, Triggers, Graphs, Discovery, Web) | Clicking on the element name will display items, triggers etc. of the host. The number of the respective elements is displayed in parentheses. |
| Interface | The main interface of the host is displayed. |
| Templates | The templates linked to the host are displayed. If other templates are contained in the linked template, those are displayed in parentheses, separated by a comma. Clicking on a template name will open its configuration form. |
| Status | Host status is displayed - Monitored or Not monitored. By clicking on the status you can change it. |
| Availability | Availability of the host is displayed. Four icons each represent a supported interface (Zabbix agent, SNMP, IPMI, JMX). If the interface is configured and available, it is displayed in green. If it is configured and unavailable, it is displayed in red, and, upon mouseover, will display details of why the interface cannot be reached. |
To configure a new host, click on the Create host button in the top right-hand corner. To import a host from an XML file, click on the Import button in the top right-hand corner.
Mass editing options
A dropdown below the list offers some mass-editing options:
- Export selected - export the hosts to an XML file
- Mass update - update several properties for a number of hosts at once
- Enable selected - change host status to Monitored
- Disable selected - change host status to Not monitored
- Delete selected - delete the hosts
To use these options, mark the check-boxes before the respective hosts, then select the required option and click on "Go".
Filter
As the list may contain very many hosts, it may be needed to filter out the ones you really need.
The narrow blue bar just below the Hosts bar is actually a link to the filter. If you click on it, a filter becomes available where you can filter hosts by name, DNS, IP or port number.

