16 The Queue
Overview
Zabbix Queue displays items that are waiting for a refresh. The Queue is just a logical representation of data from the database. There is no IPC queue or any other queue mechanism in Zabbix.
Statistics shown by the Queue is a good indicator of performance of Zabbix server.
How to read
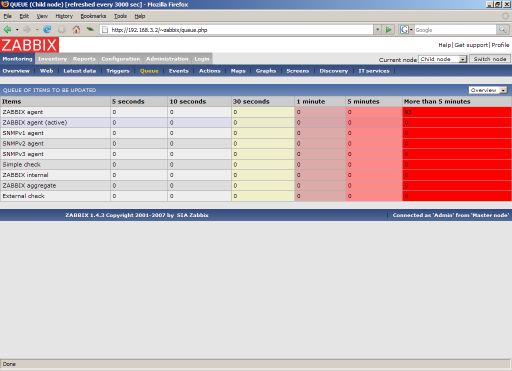
The Queue on a standalone application or when displayed for a master node shows items waiting for a refresh.

In this case, we see that we have three items of type Zabbix agent waiting to be refreshed 0-5 seconds, and one item of type Zabbix agent (active) waiting more than five minutes (perhaps the agent is down?). Note that information displayed for a child node is not up-to-date. The master node receives historical data with a certain delay (normally, up-to 10 seconds for inter-node data transfer), so the information is delayed.

On the screenshot we see that there are 93 items waiting more than 5 minutes for refresh on node "Child", however we should not trust the information as it depends on:
- performance of the Child node
- communications between Master and Child nodes
- possible local time difference between Master and Child nodes
A special item key zabbix[queue] can be used to monitor health of the queue by Zabbix. There's a full list of such internal items in item configuration section.

