14 IT Services
IT Services are intended for those who want to get a high-level (business) view of monitored infrastructure. In many cases, we are not interested in low-level details, like lack of disk space, high processor load, etc. What we are interested in is availability of service provided by our IT department. We can also be interested in identifying weak places of IT infrastructure, SLA of various IT services, structure of existing IT infrastructure, and many other information of higher level.
Zabbix IT Services provide answers to all mentioned questions.
IT Services is hierarchy representation of monitored data.
A very simple IT service structure may look like:
IT Service
|
|-Workstations
| |
| |-Workstation1
| |
| |-Workstation2
|
|-Servers
Each node of the structure has attribute status. The status is calculated and propagated to upper levels according to selected algorithm. At the lowest level of IT Services are triggers. The status of individual nodes is affected by the status of their triggers.
Note that triggers with severities Not classified and Information do not impact SLA calculation.
Configuring IT Services
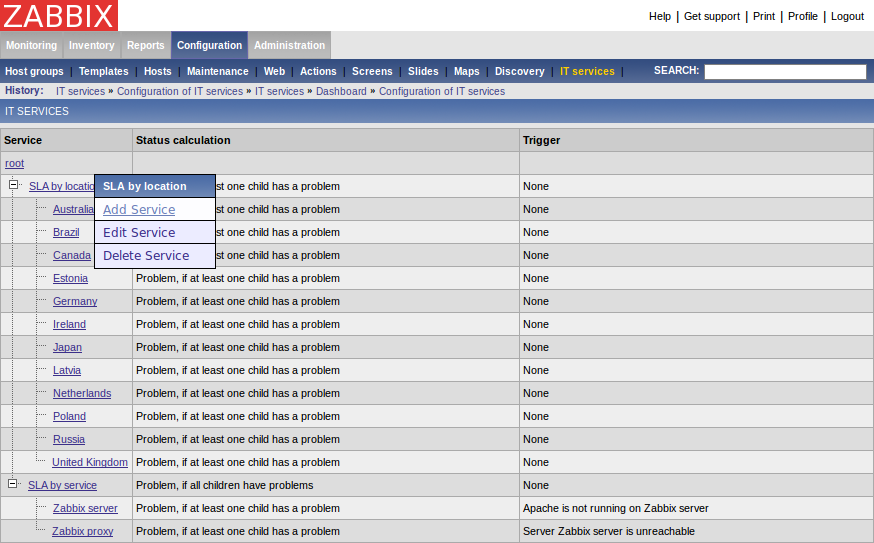
To configure IT Services, go to Configuration → IT Services.
On this screen you can build a hierarchy of your monitored infrastructure. The highest-level parent service is 'root'. You can build your hierarchy downward by adding lower-level parent services and then individual nodes to them.

Click on a service to add services to it or edit the service. A form is displayed where you can edit service attributes.
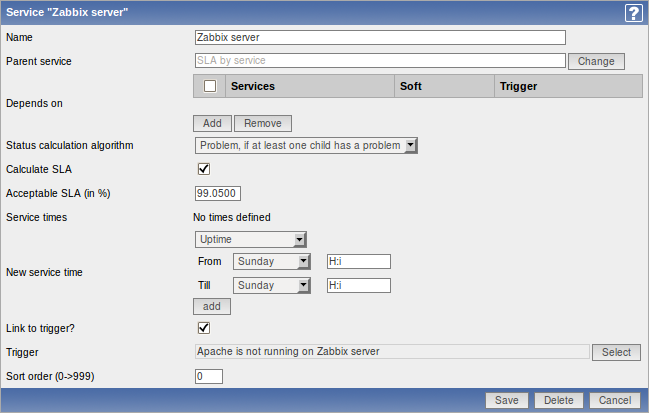
Configuring an IT Service

IT Service attributes:
| Parameter | Description |
|---|---|
| Name | Service name. |
| Parent service | Parent service the service belongs to. |
| Depends on | List of child services the service depends on. |
| Status calculation algorithm | Method of calculating service status: Do not calculate - do not calculate service status Problem, if at least one child has a problem - considered to be a problem if already one child service has a problem Problem, if all children have problems - considered to be a problem only if all child services are having problems |
| Calculate SLA | Enable SLA calculation and display. |
| Acceptable SLA (in %) | SLA percentage that is acceptable for this service. Used for reporting. |
| Service times | By default, all services are expected to operate 24x7x365. If exceptions needed, add new service times. |
| New service time | Service times: One-time downtime - a single downtime. Service state within this period does not affect SLA. Uptime - service uptime Downtime - service state within this period does not affect SLA. Add the respective hours. Note: Service times affect only the service they are configured for. Thus, a parent service will not take into account the service time configured on a child service (unless a corresponding service time is configured on the parent service as well). |
| Link to trigger | Linkage to trigger: None - no linkage trigger name - linked to the trigger, thus depends on the trigger status Services of the lowest level must be linked to triggers. (Otherwise their state will not be represented accurately.) |
| Sort order | Sort order for display, lowest comes first. |
Monitoring IT Services
To monitor IT Services, go to Monitoring → IT Services.

A list of the existing IT services is displayed along with data of their status and SLA. From the dropdown in the upper right corner you can select a desired period for display.
Displayed data:
| Parameter | Description |
|---|---|
| Service | Service name. |
| Status | Status of service: OK - no problems (trigger colour and severity) - indicates a problem and its severity |
| Reason | Indicates the reason of problem (if any). |
| SLA (period) | Displays SLA bar. Green/red ratio indicates the proportion of availability/problems. |
| SLA | Displays acceptable SLA/current SLA value. If current value is below the acceptable level, it is displayed in red. |
| Graph | Contains link to a graph of availability data. |
You can also click on the green/red SLA bar to access the IT Services Availability Report.

Here you can assess IT service availability data over a longer period of time on daily/weekly/monthly/yearly basis.

