Is this not what you were looking for? Switch to the current version or choose one from the drop-down menu.
3 Host export
For Zabbix versions up to 1.8.3, host and template export is available at Configuration → Export/Import. Starting with 1.8.3, import and export controls are available on corresponding configuration pages (Configuration → Hosts and Configuration → Templates).
3.1 Since Zabbix 1.8.3
3.1.1 Step 1
Navigate either to Configuration → Hosts or Configuration → Templates, depending on which ones you want to export. Mark checkboxes next to elements to be exported.
3.1.2 Step 2
Make sure that Export selected is chosen in the activity dropdown below host or template list, then click Go and save the file.
3.2 Up to Zabbix 1.8.3
Step 1
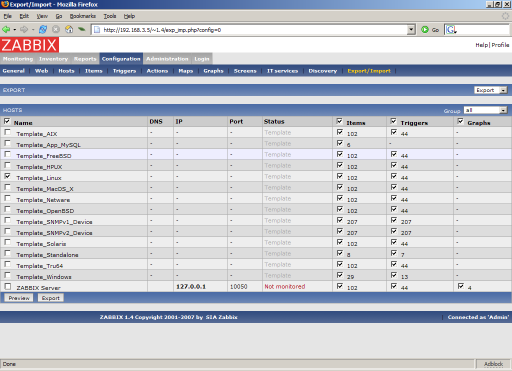
Select elements for export

We selected host "Template_Linux" and all its items and triggers.
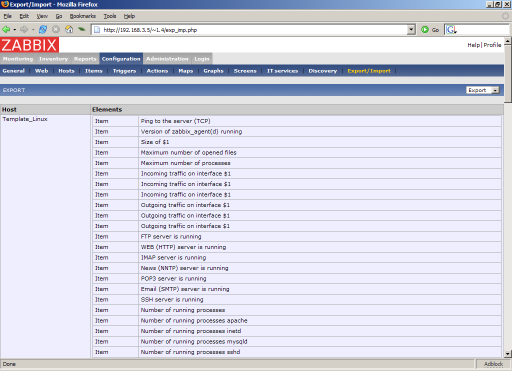
Press button "Preview" to see list of elements to be exported:

Step 2
Export data
Press button "Export" to export selected elements to a local XML file with default name zabbix_export.xml. The file has the following format (one element of each type is shown):
<?xml version="1.0"?>
       <zabbix_export version="1.0" date="11.05.07" time="11.11">
         <hosts>
             <host name="ZABBIX Server">
                 <useip>1</useip>
                 <ip>127.0.0.1</ip>
                 <port>10050</port>
                 <status>1</status>
                 <groups>
                 </groups>
                 <items>
                     <item type="0" key="agent.ping" value_type="3">
                         <description>Ping to the server (TCP)</description>
                         <delay>30</delay>
                         <history>7</history>
                         <trends>365</trends>
                         <snmp_port>161</snmp_port>
                         <valuemap>Service state</valuemap>
                         <applications>
                             <application>General</application>
                         </applications>
                     </item>
                         ....
                 </items>
                 <triggers>
                     <trigger>
                         <description>Version of zabbix_agent(d) was changed on {HOSTNAME}</description>
                         <expression>{{HOSTNAME}:agent.version.diff(0)}>0</expression>
                         <priority>3</priority>
                     </trigger>
                         ....
                 <graphs>
                     <graph name="CPU Loads" width="900" height="200">
                         <show_work_period>1</show_work_period>
                         <show_triggers>1</show_triggers>
                         <yaxismin>0.0000</yaxismin>
                         <yaxismax>100.0000</yaxismax>
                         <graph_elements>
                             <graph_element item="{HOSTNAME}:system.cpu.load[,avg15]">
                                 <color>990000</color>
                                 <yaxisside>1</yaxisside>
                                 <calc_fnc>2</calc_fnc>
                                 <periods_cnt>5</periods_cnt>
                             </graph_element>
                             <graph_element item="{HOSTNAME}:system.cpu.load[,avg1]">
                                 <color>009900</color>
                                 <yaxisside>1</yaxisside>
                                 <calc_fnc>2</calc_fnc>
                                 <periods_cnt>5</periods_cnt>
                             </graph_element>
                             <graph_element item="{HOSTNAME}:system.cpu.load[,avg5]">
                                 <color>999900</color>
                                 <yaxisside>1</yaxisside>
                                 <calc_fnc>2</calc_fnc>
                                 <periods_cnt>5</periods_cnt>
                             </graph_element>
                         </graph_elements>
                     </graph>
                         ....
                 </graphs>
             </host>
                         ....
         </hosts>
       </zabbix_export>