This is the documentation page for an unsupported version of Zabbix.
Is this not what you were looking for? Switch to the current version or choose one from the drop-down menu.
Is this not what you were looking for? Switch to the current version or choose one from the drop-down menu.
Table of Contents
4 Bar reports
Overview
In the Reports → Bar reports section you can create some customized bar reports on run-time. Reports can be viewed, but are not saved.
From the dropdown in the upper right corner you can choose one of the three types of available bar reports. Then use the Filter options to create the report.
| Parameter | Description |
|---|---|
| Title | Name of the report. |
| X label | Label displayed below the X axis. |
| Y label | Label displayed alongside the Y axis. |
| Legend | With this checkbox marked, a legend will be displayed alongside the report. |
| Scale | Picking a scale will separate out the value bars for either every hour/day/week/month/year. So, for example, picking a daily scale will display one bar for the values of one day. This parameter is available for the first and third report type. |
| Period | Enter the start and end of the evaluation period. With the second report type, several custom periods, each displayed in different colour, can be entered. |
| Items | Click on Add to select the items whose data you wish to display. |
Specifically for the third report type:
| Groups | From the Other groups pane select host groups. Item values for any host in the group having that item will be displayed. |
| Hosts | From the Other hosts pane select hosts. Item values for any selected host having that item will be displayed. |
| Average | Select whether to display averaged data for an hour/day/week/month/year. |
| Item | Select the item whose data you wish to display. |
| Palette | Pick a palette of colours for displaying side-by-side bars and colour intensity (middle/darken/brighter). |
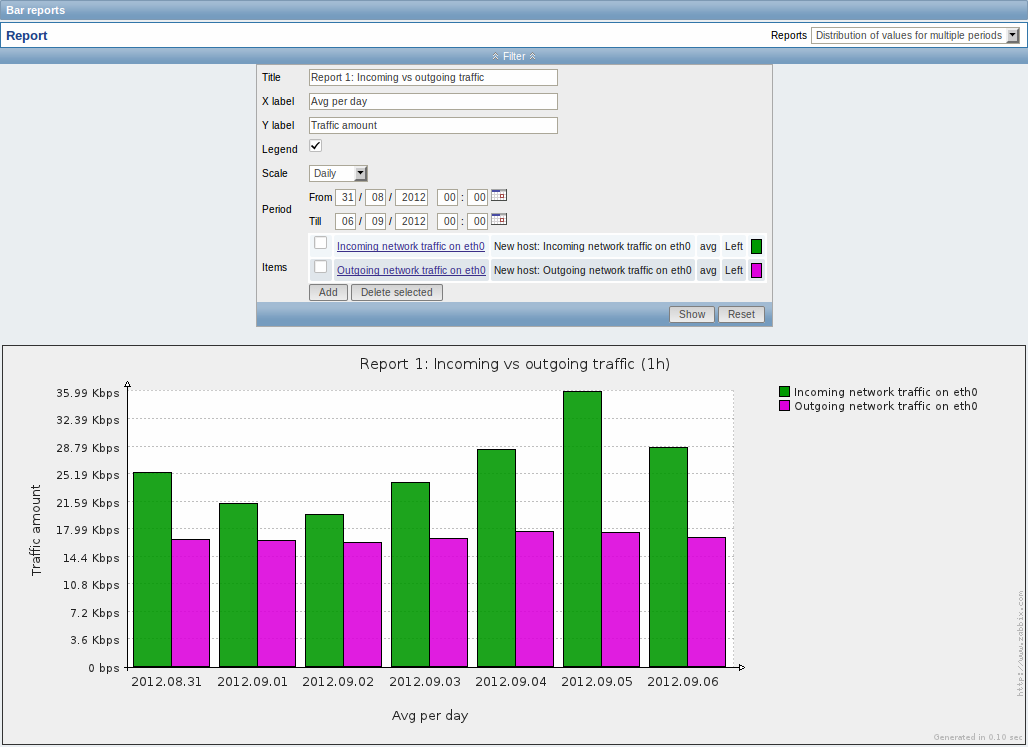
Item data comparison
The first bar report offers a possibility to simply compare item values side by side.

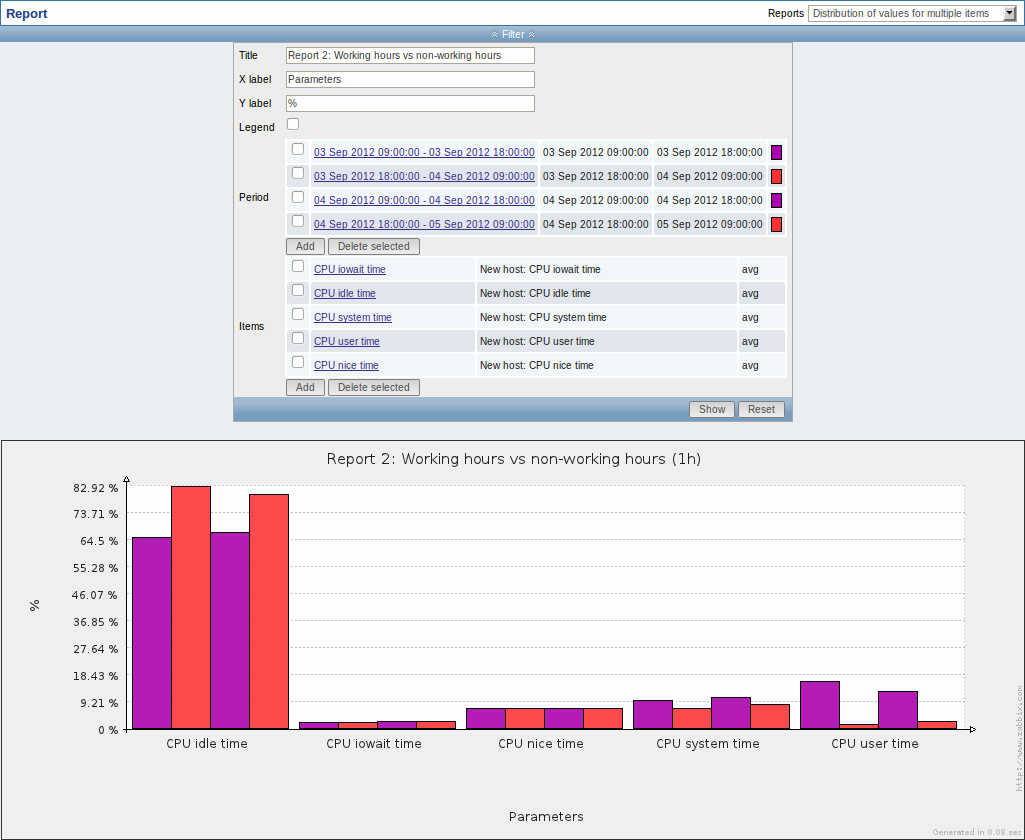
Period data comparison
The second bar report offers a possibility to compare the values of one or several items in custom periods.

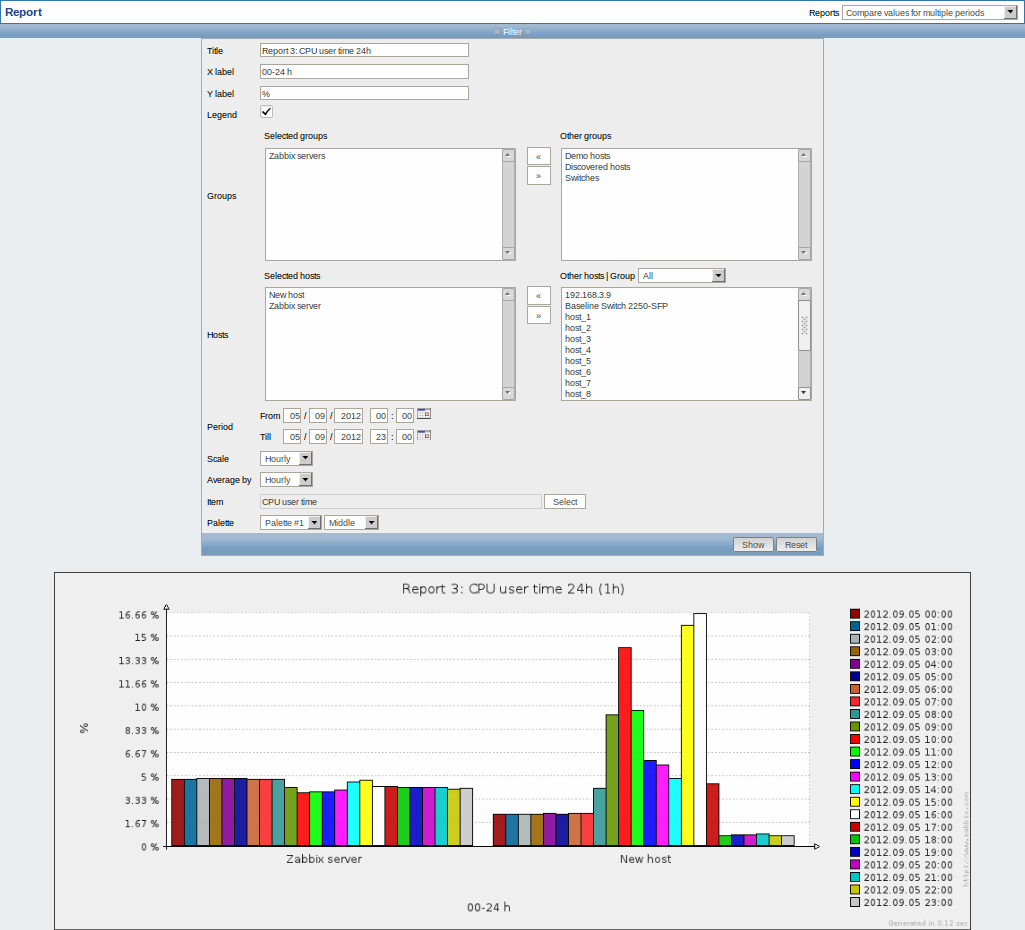
One item data comparison
The third bar report offers a possibility to compare the values of one item for different hosts/predefined intervals (hourly/daily/weekly/monthly/yearly).

© 2001-2025 by Zabbix SIA. All rights reserved.
Except where otherwise noted, Zabbix Documentation is licensed under the following license
