Is this not what you were looking for? Switch to the current version or choose one from the drop-down menu.
2 Inventory
Overview
You can keep the inventory of networked devices in Zabbix.
There is a special Inventory menu in the Zabbix frontend. However, you will not see any data there initially and it is not where you enter data. Building inventory data is done manually when configuring a host or automatically by using some automatic population options.
Building inventory
Manual mode
When configuring a host, in the Host inventory tab you can enter such details as the type of device, serial number, location, responsible person, etc - data that will populate inventory information.
If a URL is included in host inventory information and it starts with 'http' or 'https', it will result in a clickable link in the Inventory section.
Automatic mode
Host inventory can also be populated automatically. For that to work, when configuring a host the inventory mode in the Host inventory tab must be set to Automatic.
Then you can configure host items to populate any host inventory field with their value, indicating the destination field with the respective attribute (called Item will populate host inventory field) in item configuration.
Items that are especially useful for automated inventory data collection:
- system.hw.chassis[full|type|vendor|model|serial] - default is [full], root permissions needed
- system.hw.cpu[all|cpunum,full|maxfreq|vendor|model|curfreq] - default is [all,full]
- system.hw.devices[pci|usb] - default is [pci]
- system.hw.macaddr[interface,short|full] - default is [all,full], interface is regexp
- system.sw.arch
- system.sw.os[name|short|full] - default is [name]
- system.sw.packages[package,manager,short|full] - default is [all,all,full], package is regexp
Inventory mode selection
Inventory mode can be selected in the host configuration form.
Inventory mode by default for new hosts is selected based on the Default host inventory mode setting in Administration → General → Other.
For hosts added by network discovery or autoregistration actions, it is possible to define a Set host inventory mode operation selecting manual or automatic mode. This operation overrides the Default host inventory mode setting.
Inventory overview
The details of all existing inventory data are available in the Inventory menu.
In Inventory → Overview you can get a host count by various fields of the inventory.
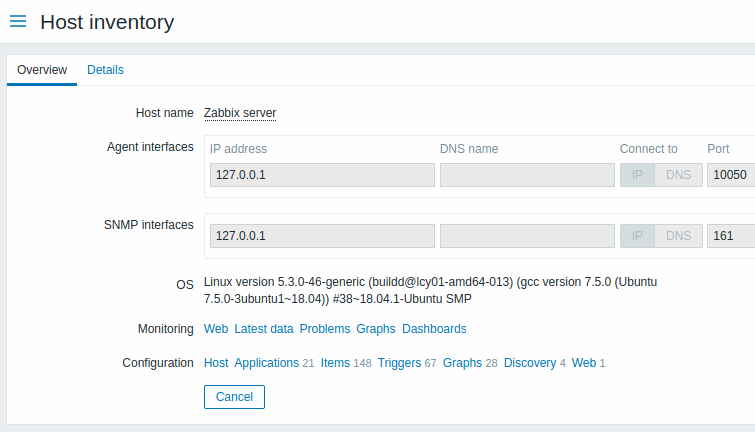
In Inventory → Hosts you can see all hosts that have inventory information. Clicking on the host name will reveal the inventory details in a form.

The Overview tab shows:
| Parameter | Description | ||||
|---|---|---|---|---|---|
| Host name | Name of the host. Clicking on the name opens a menu with the scripts defined for the host. Host name is displayed with an orange icon, if the host is in maintenance. |
||||
| Visible name | Visible name of the host (if defined). | ||||
| Host (Agent, SNMP, JMX, IPMI) interfaces |
This block provides details of the interfaces configured for the host. | ||||
| OS | Operating system inventory field of the host (if defined). | ||||
| Hardware | Host hardware inventory field (if defined). | ||||
| Software | Host software inventory field (if defined). | ||||
| Description | Host description. | ||||
| Monitoring | Links to monitoring sections with data for this host: Web, Latest data, Triggers, Problems, Graphs, Screens. | ||||
| Configuration | Links to configuration sections for this host: Host, Applications, Items, Triggers, Graphs, Discovery, Web. The amount of configured entities is listed in parenthesis after each link. |
||||
The Details tab shows all inventory fields that are populated (are not empty).
Inventory macros
There are host inventory macros {INVENTORY.*} available for use in notifications, for example:
"Server in {INVENTORY.LOCATION1} has a problem, responsible person is {INVENTORY.CONTACT1}, phone number {INVENTORY.POC.PRIMARY.PHONE.A1}."
For more details, see the supported macro page.
