
1 Monitor Linux with Zabbix agent
Introduction
This page walks you through the steps required to start basic monitoring of Linux machines with Zabbix. The steps described in this tutorial can be applied to any Linux-based operating system.
Who this guide is for
This guide is designed for new Zabbix users and contains the minimum set of steps required to enable basic monitoring of your Linux machine. If you are looking for deep customization options or require more advanced configuration, see Configuration section of Zabbix manual.
Prerequisites
Before proceeding with this guide, you need to download and install Zabbix server and Zabbix frontend according to the instructions for your OS.
Install Zabbix agent
Zabbix agent is the process responsible for gathering data.
Check your Zabbix server version:
zabbix_server -VInstall Zabbix agent of the same version (recommended) on the Linux machine that you want to monitor. Based on your monitoring needs, it may be the same machine, where Zabbix server is installed, or a completely different machine.
Choose the most suitable installation method:
-
Run as a Docker container - see the list of available images in Zabbix Docker repository.
-
Install from Zabbix packages (available for Alma Linux, CentOS, Debian, Oracle Linux, Raspberry Pi OS, RHEL, Rocky Linux, SUSE Linux Enterprise Server, Ubuntu).
-
Compile from sources.
Configure Zabbix for monitoring
Zabbix agent can collect metrics in active or passive mode (simultaneously).
A passive check is a simple data request. Zabbix server or proxy asks for some data (for example, CPU load) and Zabbix agent sends back the result to the server. Active checks require more complex processing. The agent must first retrieve from the server(s) a list of items for independent processing and then bulk send the data back. See Passive and active agent checks for more info.
Monitoring templates provided by Zabbix usually offer two alternatives - a template for Zabbix agent and a template for Zabbix agent (active). With the first option, the agent will collect metrics in passive mode. Such templates will deliver identical monitoring results, but using different communication protocols.
Further Zabbix configuration depends on whether you select a template for active or passive Zabbix agent checks.
Passive checks
Zabbix agent
1. Open the agent configuration file on the machine where the agent is installed.
sudo vi /etc/zabbix/zabbix_agentd.conf2. Add the IP address or DNS name (and optional port) of your Zabbix server to the server parameter. For example:
Server=192.0.2.0:10051Zabbix agent will use this address to accept incoming connections only from the specified Zabbix servers or proxies to retrieve data.
3. Restart Zabbix agent.
systemctl restart zabbix-agentZabbix frontend
1. Log in to Zabbix frontend.
2. Create a host in Zabbix web interface.
- In the Host name field, enter a host name (e.g., "Linux server").
- In the Templates field, type or select the template "Linux by Zabbix agent" that will be linked to the host.
- In the Host groups field, type or select a host group (e.g., "Linux servers").
- In the Interfaces parameter, add Agent interface and specify the IP address or DNS name of the Linux machine where the agent is installed.
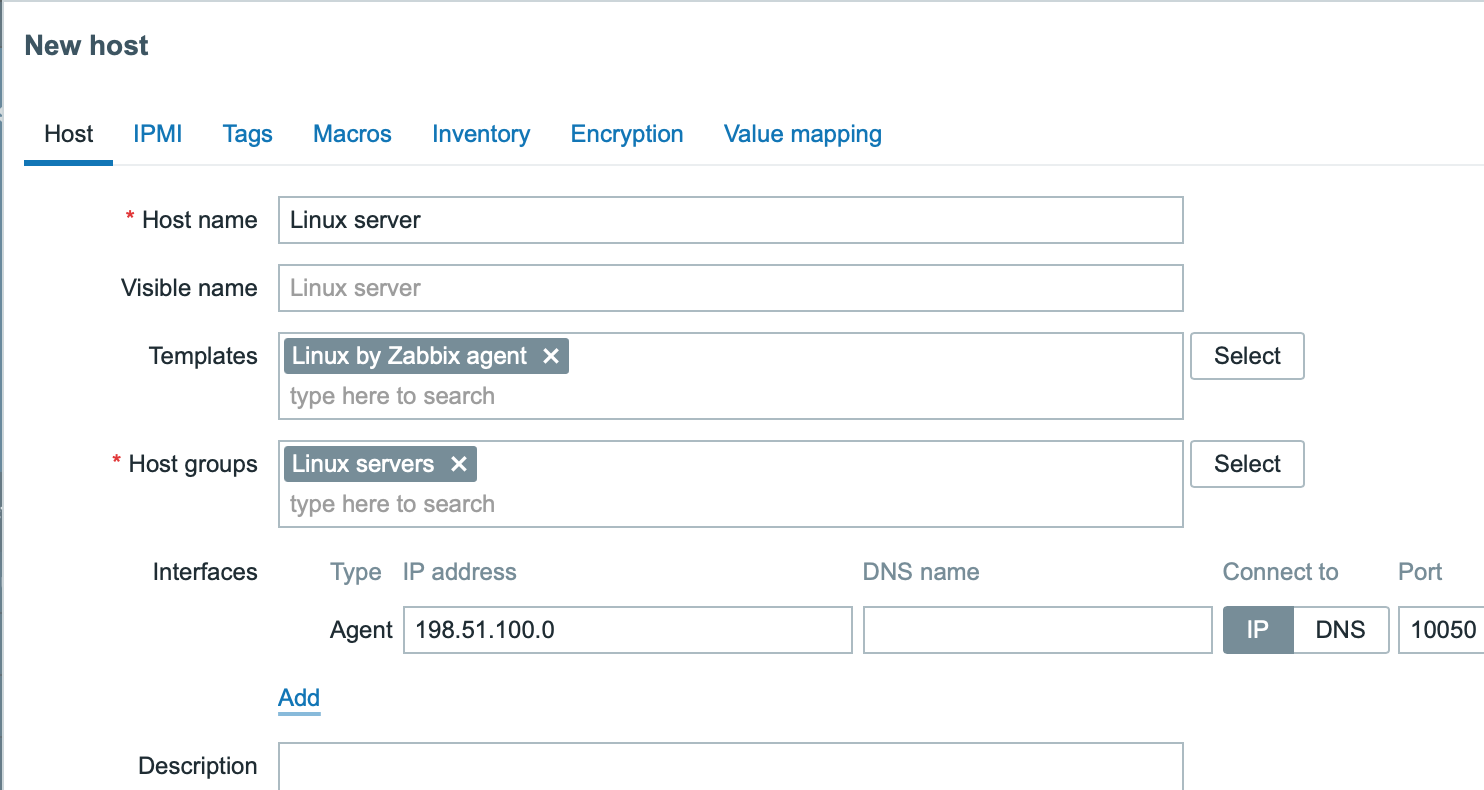
3. Click on Add to add the host. This host will represent the monitored Linux machine.
Active checks
Zabbix agent
1. Open the agent configuration file on the machine where the agent is installed.
sudo vi /etc/zabbix/zabbix_agentd.conf2. Add the IP address or DNS name (and optional port) of your Zabbix server to the ServerActive parameter. For example:
ServerActive=192.0.2.0:10051Zabbix agent will use this address to connect to Zabbix server's trapper port (default: 10051) and request the configuration data for active checks.
3. Define the Hostname parameter, which must match the host name that will be defined in Zabbix frontend. In our example, it is:
Hostname=Linux serverThe Hostname value must match because, for active checks, Zabbix agent uses it to retrieve the correct host configuration from the server. Specifically, the agent initiates a connection to the server and identifies itself using the Hostname value. The server then provides the monitoring configuration for that host. If these values differ, the agent will not receive the appropriate configuration, resulting in missing metrics or monitoring issues.
4. Restart Zabbix agent.
systemctl restart zabbix-agentZabbix frontend
1. Log in to Zabbix frontend.
2. Create a host in Zabbix web interface.
- In the Host name field, enter a host name (e.g., "Linux server") that matches the Hostname parameter value defined earlier in the agent configuration file.
- In the Templates field, type or select the template "Linux by Zabbix agent active" that will be linked to the host.
- In the Host groups field, type or select a host group (e.g., "Linux servers").
- Leave Interfaces undefined; an interface is not necessary for active checks because the agent initiates the connection to the server instead of listening for a connection from the server.
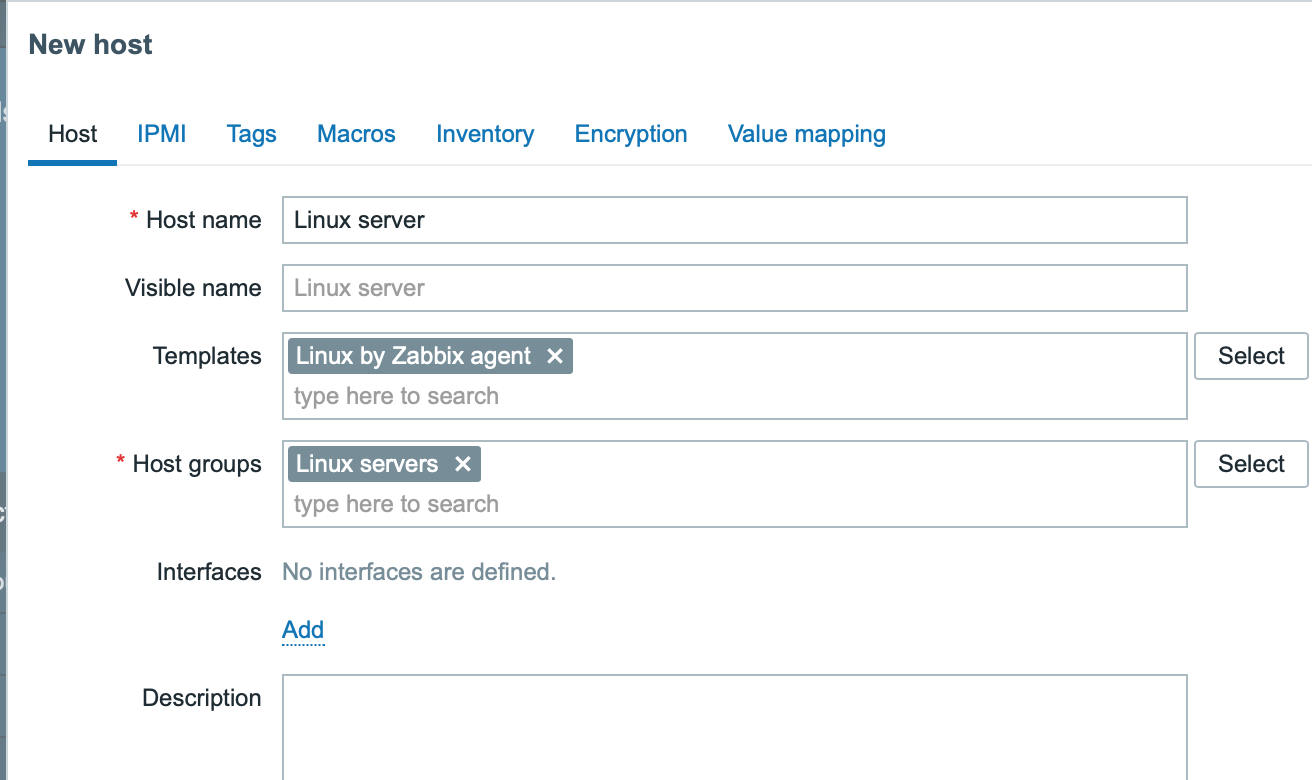
3. Click on Add to add the host. This host will represent the monitored Linux machine.
View collected metrics
Congratulations! At this point, Zabbix is already monitoring your Linux machine.
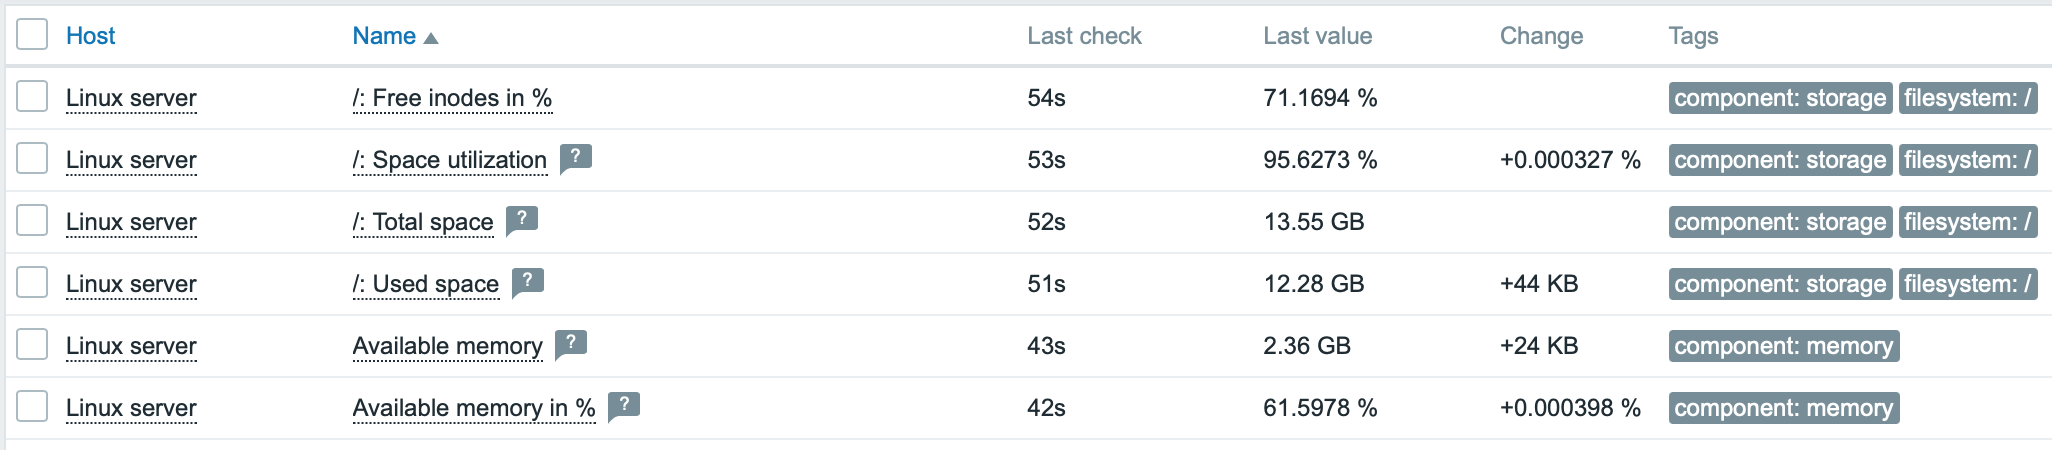
To view collected metrics, open the Monitoring->Hosts menu section and click on the Latest data next to the host.

This action will open a list of all the latest metrics collected from Linux server host.
Set up problem alerts
Zabbix can notify you about a problem with your infrastructure using a variety of methods. This guide provides configuration steps for sending email alerts.
1. Go to the User settings -> Profile, switch to the tab Media and add your email.
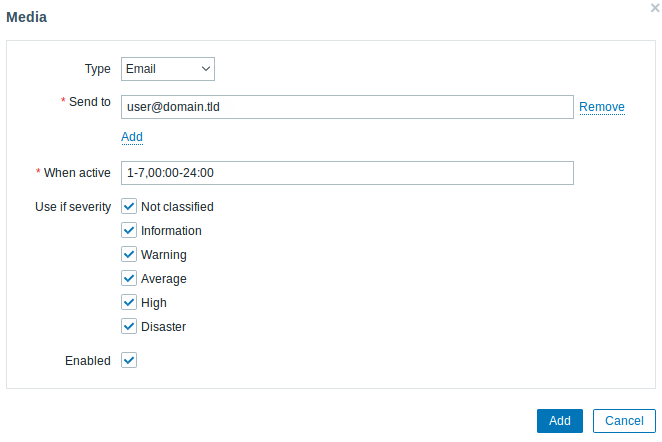
2. Follow the guide for Receiving problem notification.
Next time, when Zabbix detects a problem you should receive an alert via email.
Test your configuration
On Linux, you can simulate high CPU load and as a result receive a problem alert by running:
cat /dev/urandom | md5sumYou may need to run several md5sum processes for CPU load to exceed the threshold.
When Zabbix detects the problem, it will appear in the Monitoring->Problems section.

If the alerts are configured, you will also receive the problem notification.
See also:
- Creating an item - how to start monitoring additional metrics (custom monitoring without templates).
- Zabbix agent items, Zabbix agent items for Windows - full list of metrics you can monitor using Zabbix agent on Windows.
- Problem escalations - how to create multi-step alert scenarios (e.g., first send message to the system administrator, then, if a problem is not resolved in 45 minutes, send message to the data center manager).
- Installation from packages - how to install Zabbix components using official RPM and DEB packages for various Linux distributions, ensuring access to the latest features and bug fixes.