
8 Monitor websites with Browser items
Introduction
This page walks you through the steps required to start basic monitoring of websites with Browser items.
Who this guide is for
This guide is designed for new Zabbix users and contains the minimum set of steps required to enable basic monitoring of websites with Browser items. If you are looking for deep customization options or require more advanced configuration, see the Browser items page or the Configuration section of Zabbix manual.
Prerequisites
Before proceeding with this guide, you need to download and install Zabbix server and Zabbix frontend according to the instructions for your OS.
Depending on your environment, some steps in this guide may slightly differ. This guide is based on an environment running Ubuntu.
Configure WebDriver
Browser items require an automation framework (either Selenium Server or a plain WebDriver, for example, ChromeDriver) as a web testing endpoint that controls and interacts with a browser, executing test commands such as clicking buttons or entering text. As an example, this guide will use Selenium Server with Chrome in a Docker container.
It is assumed that Docker is already configured. This guide does not cover the configuration of Docker. For installation instructions, see Install Docker Engine on Ubuntu.
1. Launch Selenium Server with Chrome in a Docker container with the following options:
- docker run --name browser - runs a new Docker container named "browser";
- -p 4444:4444 - maps port 4444 on your host machine to port 4444 on the container (this is the port used by Selenium Server to accept commands);
- -p 7900:7900 - maps port 7900 on your host machine to port 7900 on the container (this is the port used by the Virtual Network Computing (VNC) server, allowing you to view the browser GUI remotely; requires a VNC client);
- --shm-size="2g" - allocates 2GB of shared memory to the container (this is important for Chrome to run properly, as it can require a significant amount of shared memory to avoid crashes);
- -d - runs the container in detached mode, meaning it will run in the background;
- selenium/standalone-chrome:latest - specifies the Docker image to use; in this case, the latest version of Selenium Server with Chrome.
docker run --name browser \
-p 4444:4444 \
-p 7900:7900 \
--shm-size="2g" \
-d selenium/standalone-chrome:latest
2. Ensure that the browser Docker container is running and accessible.
- Retrieve the IP address of the container (in this example, 192.0.2.1):
ip addr

# 1: lo: <LOOPBACK,UP,LOWER_UP>
#    ...
# 3: docker0: <NO-CARRIER,BROADCAST,MULTICAST,UP> ...
#    inet 192.0.2.1/16 brd 192.0.255.255 scope global docker0
# ...- Test the connection to the container with Ncat:
nc -zv 192.0.2.1 4444

# Connection to 192.0.2.1 4444 port [tcp/*] succeeded!- Retrieve the webpage content from Selenium Server with curl:
curl -L 192.0.2.1:4444

# <!DOCTYPE html>
# <html lang="en">
#
# <head>
#   <meta charset="utf-8"/>
#   <link href="favicon.svg" rel="icon" type="image/svg">
#   <meta content="width=device-width, initial-scale=1" name="viewport"/>
#   <link href="logo192.png" rel="apple-touch-icon"/>
#   <link href="manifest.json" rel="manifest"/>
#   <title>Selenium Grid</title>
# </head>
#
# <body>
# ...
For troubleshooting, refer to Docker documentation.
Configure Zabbix server
Browser items are executed and processed by browser poller Zabbix processes that need to be enabled by adjusting the StartBrowserPollers server configuration parameter. Additionally, the WebDriverURL parameter should specify the previously configured web testing endpoint.
By default, the StartBrowserPollers parameter is set to 1, therefore you only need to specify the web testing endpoint.
1. Open the Zabbix server configuration file.
vi /etc/zabbix/zabbix_server.conf2. Locate and set the WebDriverURL parameter in Zabbix server configuration file:
### Option: WebDriverURL
#   WebDriver interface HTTP[S] URL. For example http://localhost:4444 used with Selenium WebDriver standalone server.
#
# Mandatory: no
# Default:
# WebDriverURL=

WebDriverURL=192.0.2.1:4444
3. Restart Zabbix server.
systemctl restart zabbix-serverConfigure Zabbix frontend
1. Log into Zabbix frontend.
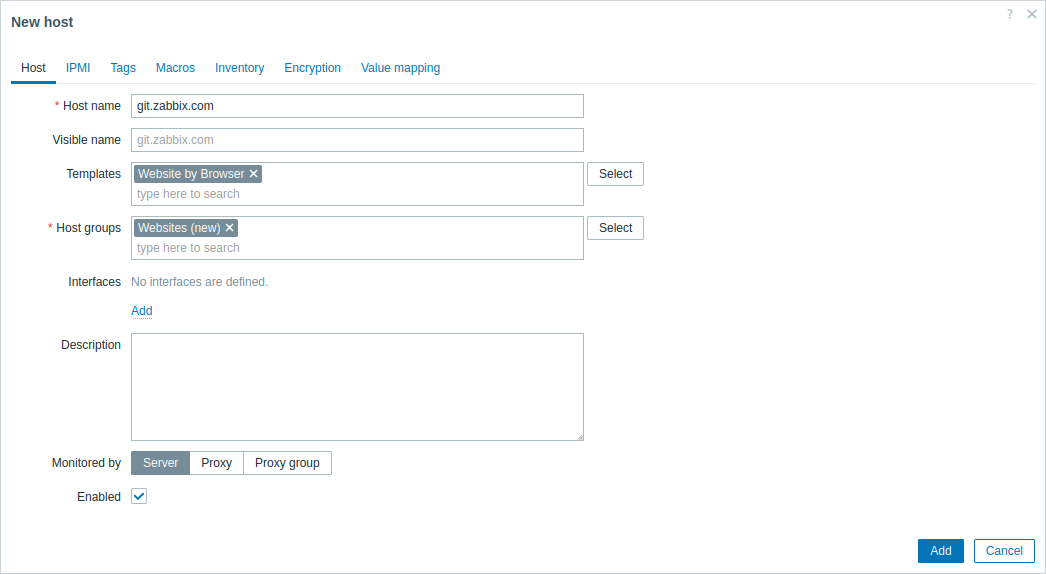
2. Create a host in Zabbix web interface:
- In the Host name field, enter a host name (for example, "git.zabbix.com").
- In the Templates field, type or select the "Website by Browser" template. For more information on this template, see Website by Browser.
- In the Host groups field, type or select a host group (for example, a new host group "Websites").
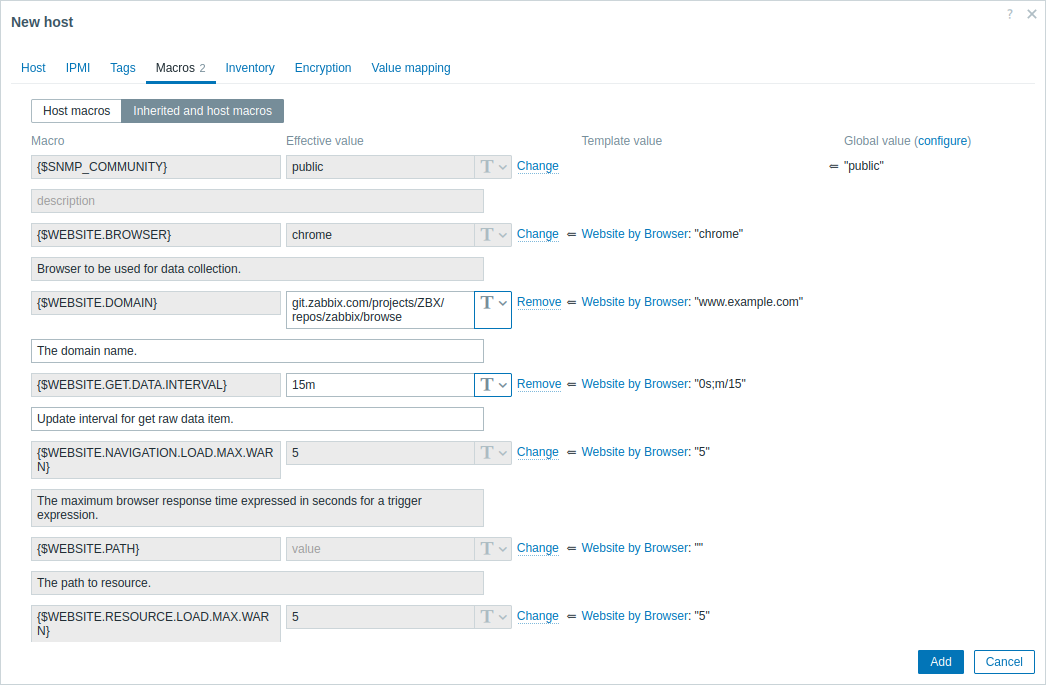
- In the Macros tab, switch to Inherited and host macros, look for the following macros and click on Change next to the macro value to update it:
- {$WEBSITE.DOMAIN} - Domain name (for example, git.zabbix.com/projects/ZBX/repos/zabbix/browse)
- {$WEBSITE.GET.DATA.INTERVAL} - Item data update interval (for example, 15m)
3. Click the Add button to create the host. This host will represent the website you want to monitor.
View collected metrics
Congratulations! At this point, Zabbix is already monitoring the website you specified.
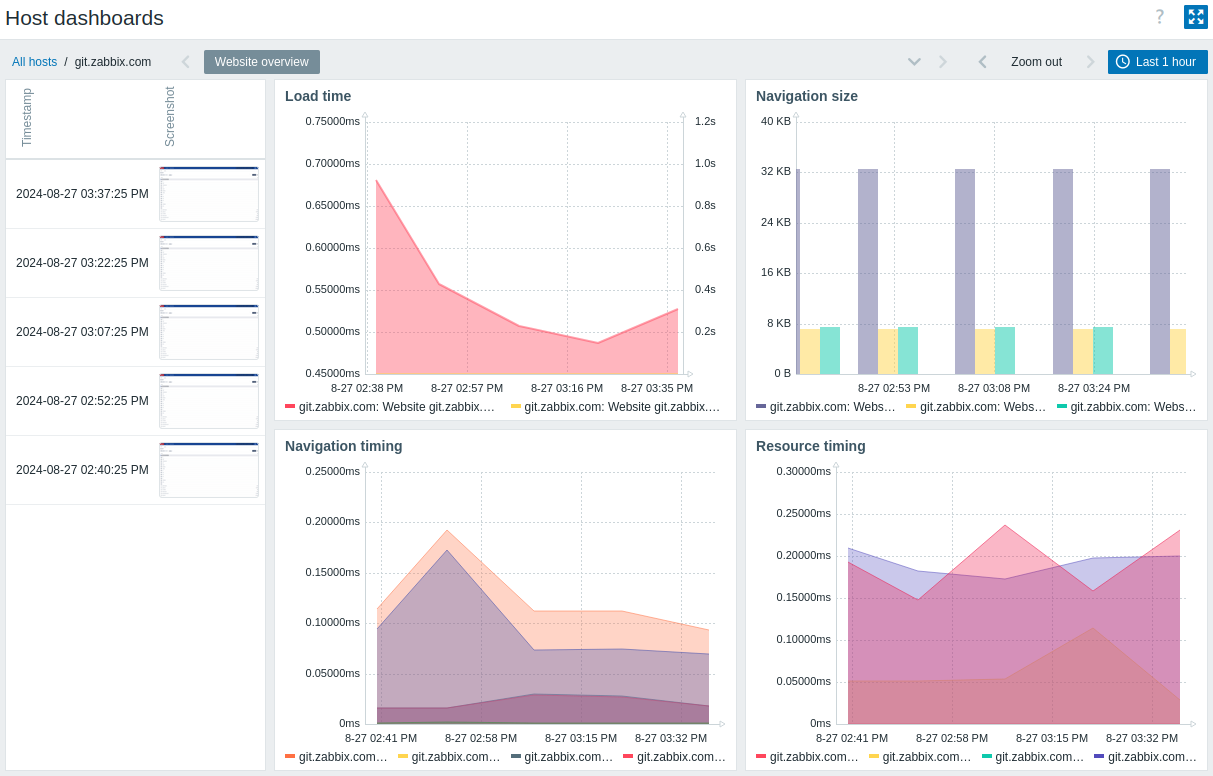
To view collected metrics, navigate to the Monitoring → Hosts menu section and click on Dashboards next to the host.
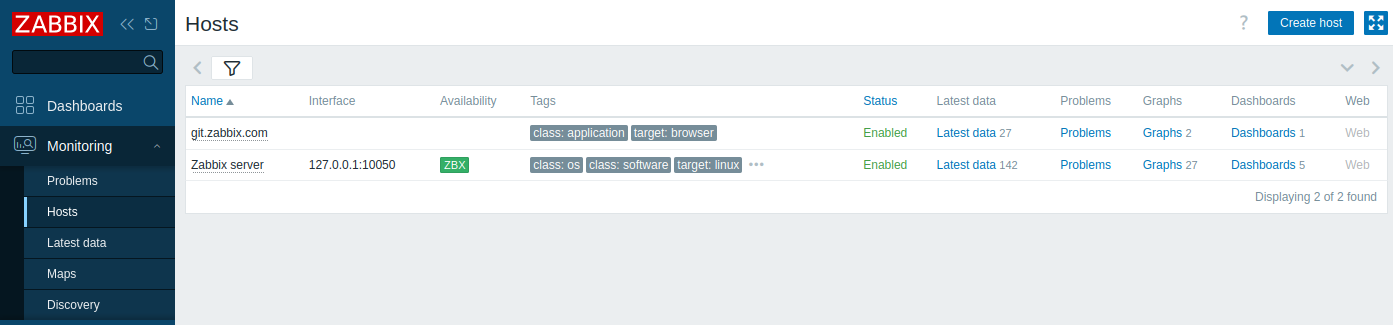
This action will take you to the host dashboard (configured on the template level) with the most important metrics collected from the website.
Set up problem alerts
Zabbix can notify you about a problem with your infrastructure using a variety of methods. This guide provides basic configuration steps for sending email alerts.
1. Navigate to User settings → Profile, switch to the Media tab and add your email.
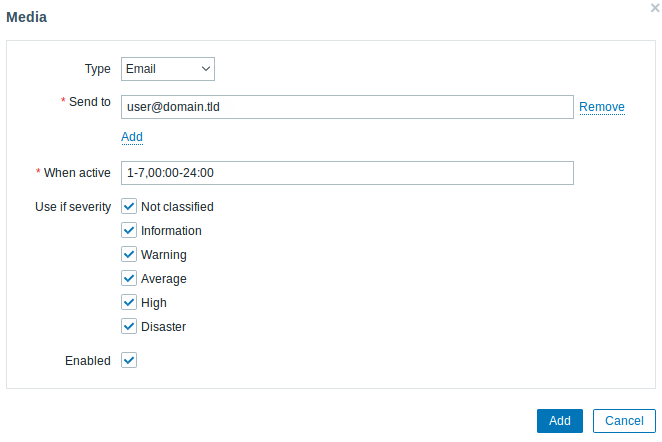
2. Follow the guide for Receiving a problem notification.
Next time, when Zabbix detects a problem, you should receive an alert via email.
Test your configuration
To test your configuration, we can simulate a real problem by updating the host configuration in Zabbix frontend.
1. Open your website host configuration in Zabbix.
2. Switch to the Macros tab and select Inherited and host macros.
3. Click on Change next to, for example, the previously configured} macro value and set an incorrect domain name (for example, /git.zabbix.com/projects/ZBX/repos/zabbix/browse).
4. Click on Update to update the host configuration.
5. In a few moments, Zabbix will detect the problem "Failed to get JSON of the requested website", because it will not be able to connect to the specified website. The problem will appear in Monitoring → Problems.
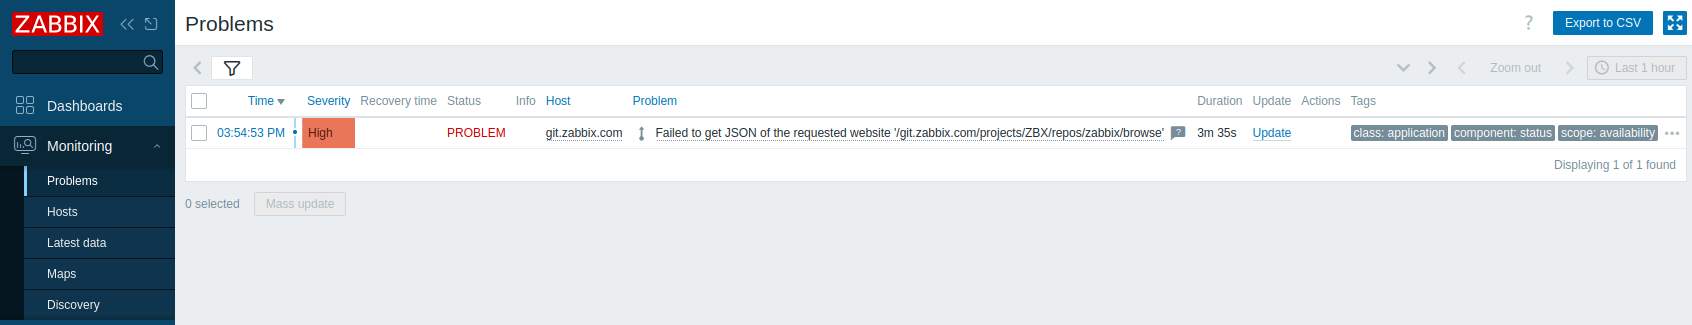
If alerts are configured, you will also receive the problem notification.
6. Change the macro value back to its previous value to resolve the problem and continue monitoring the website.
See also
- Creating an item - how to start monitoring additional metrics.
- Problem escalations - how to create multi-step alert scenarios (e.g., first send message to the system administrator, then, if a problem is not resolved in 45 minutes, send message to the data center manager).
- Browser items - how to configure Browser items.
- Template Website by Browser - additional information about the Website by Browser template.