Is this not what you were looking for? Switch to the current version or choose one from the drop-down menu.
4 New trigger
Overview
In this section you will learn how to set up a trigger.
Items only collect data. To automatically evaluate incoming data we need to define triggers. A trigger contains an expression that defines a threshold of what is an acceptable level for the data.
If that level is surpassed by the incoming data, a trigger will "fire" or go into a 'Problem' state - letting us know that something has happened that may require attention. If the level is acceptable again, trigger returns to an 'Ok' state.
Adding trigger
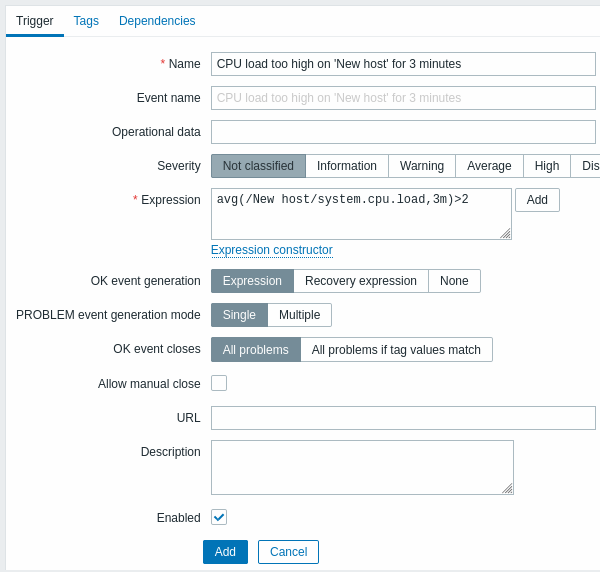
To configure a trigger for our item, go to Configuration → Hosts, find 'New host' and click on Triggers next to it and then on Create trigger. This presents us with a trigger definition form.

For our trigger, the essential information to enter here is:
Name
- Enter CPU load too high on 'New host' for 3 minutes as the value. This will be the trigger name displayed in lists and elsewhere.
Expression
- Enter: avg(/New host/system.cpu.load,3m)>2
This is the trigger expression. Make sure that the expression is entered right, down to the last symbol. The item key here (system.cpu.load) is used to refer to the item. This particular expression basically says that the problem threshold is exceeded when the CPU load average value for 3 minutes is over 2. You can learn more about the syntax of trigger expressions.
When done, click Add. The new trigger should appear in the trigger list.
Displaying trigger status
With a trigger defined, you might be interested to see its status.
If the CPU load has exceeded the threshold level you defined in the trigger, the problem will be displayed in Monitoring → Problems.

The flashing in the status column indicates a recent change of trigger status, one that has taken place in the last 30 minutes.
