Is this not what you were looking for? Switch to the current version or choose one from the drop-down menu.
8 Maps
Overview
In the Monitoring → Maps section you can configure, manage and view network maps.
When you open this section, you will either see the last map you accessed or a listing of all maps you have access to. Map listing can be filtered by name.
Since Zabbix 3.0 all maps can be either public or private. Public maps are available to all users, while private maps are accessible only to their owner and the users the map is shared with.
Map listing

Displayed data:
| Column | Description |
|---|---|
| Name | Name of the map. Click on the name to view the map. |
| Width | Map width is displayed. |
| Height | Map height is displayed. |
| Actions | Two actions are available: Properties - edit general map properties Constructor - access the grid for adding map elements |
To configure a new map, click on the Create map button in the top right-hand corner. To import a map from an XML file, click on the Import button in the top right-hand corner. The user who imports the map will be set as its owner.
Two buttons below the list offer some mass-editing options:
- Export - export the maps to an XML file
- Delete - delete the maps
To use these options, mark the checkboxes before the respective maps, then click on the required button.
Viewing maps
To view a map, click on its name in the list of all maps.

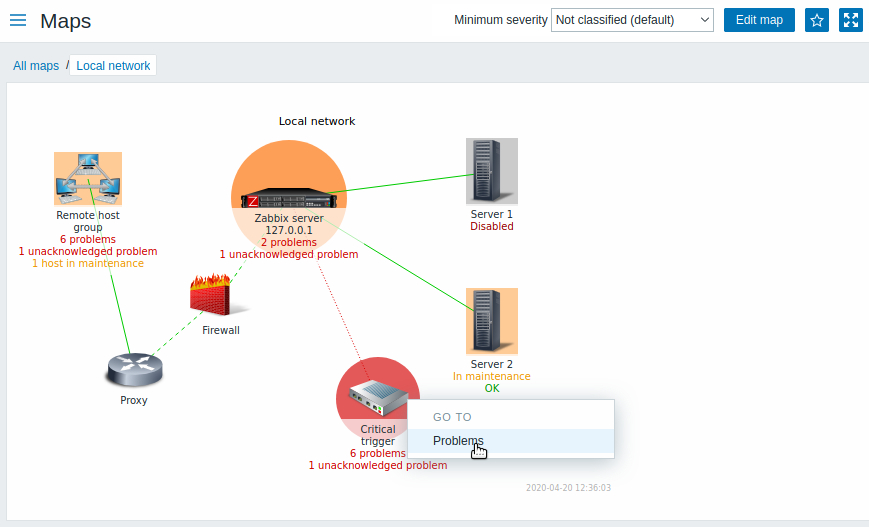
You can use the dropdown in the map title bar to select the lowest severity level of the problem triggers to display. The severity marked as default is the level set in map configuration. If the map contains a submap, navigating to the submap will retain the higher-level map severity.
Icon highlighting
If a map element is in problem status, it is highlighted with a round circle. The fill colour of the circle corresponds to the severity colour of the problem trigger. Only problems on or above the selected severity level will be displayed with the element. If all problems are acknowledged, a thick green border around the circle is displayed.
Additionally, a host in maintenance is highlighted with an orange, filled square and a disabled (not-monitored) host is highlighted with a grey, filled square. Highlighting is displayed if the Icon highlighting check-box is marked in map configuration.
Recent change markers
Inward pointing red triangles around an element indicate a recent trigger status change - one that's happened within the last 30 minutes. These triangles are shown if the Mark elements on trigger status change check-box is marked in map configuration.
Links
Clicking on a map element opens a menu with some available links.
Controls
Three control buttons are available in the title bar:
 - go to map constructor to edit the map content
 - add map to the favourites widget in the Dashboard
 - use the full browser window to display the map
Readable summary in maps
A hidden "aria-label" property is available allowing map information to be read with a screen reader. Both general map description and individual element description is available, in the following format:
- for map description:
<Map name>, <* of * items in problem state>, <* problems in total>. - for describing one element with one problem:
<Element type>, Status <Element status>, <Element name>, <Problem description>. - for describing one element with multiple problems:
<Element type>, Status <Element status>, <Element name>, <* problems>. - for describing one element without problems:
<Element type>, Status <Element status>, <Element name>.
For example, this description is available:
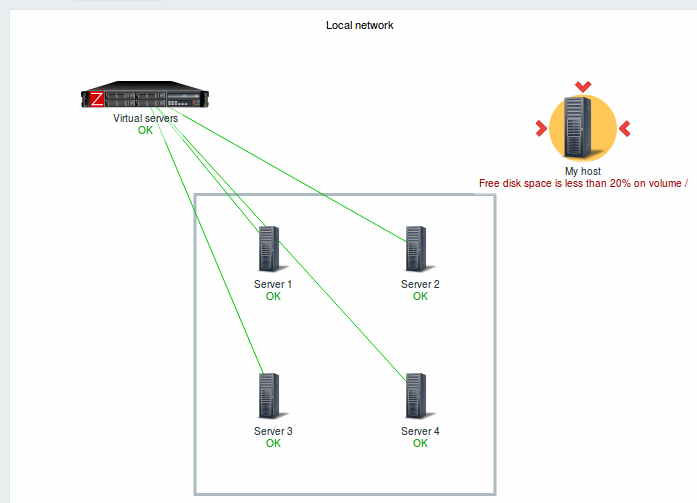
'Local network, 1 of 6 elements in problem state, 1 problem in total. Host, Status problem, My host, Free disk space is less than 20% on volume \/. Host group, Status ok, Virtual servers. Host, Status ok, Server 1. Host, Status ok, Server 2. Host, Status ok, Server 3. Host, Status ok, Server 4. 'for the following map:

Referencing a network map
Network maps can be referenced by both sysmapid and mapname GET parameters. For example,
will open the map with that name (Local network).
If both sysmapid (map ID) and mapname (map name) are specified, mapname has higher priority.
