8. Service monitoring
Overview
Service monitoring functionality is intended for those who want to get a high-level (business) view of monitored infrastructure. In many cases, we are not interested in low-level details, like the lack of disk space, high processor load, etc. What we are interested in is the availability of service provided by our IT department. We can also be interested in identifying weak places of IT infrastructure, SLA of various IT services, the structure of existing IT infrastructure, and other information of a higher level.
Zabbix service monitoring provides answers to all mentioned questions.
Services is a hierarchy representation of monitored data.
A very simple service structure may look like:
Each node of the structure has attribute status. The status is calculated and propagated to upper levels according to the selected algorithm. At the lowest level of services are triggers. The status of individual nodes is affected by the status of their triggers.
Note that triggers with a Not classified or Information severity do not impact SLA calculation.
Configuration
To configure services, go to: Configuration → Services.
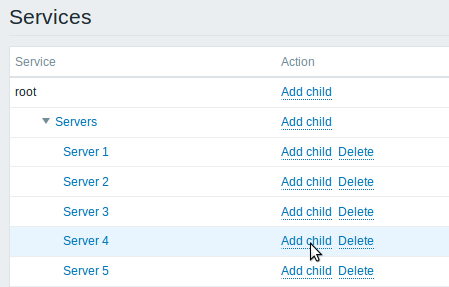
On this screen you can build a hierarchy of your monitored infrastructure. The highest-level parent service is 'root'. You can build your hierarchy downward by adding lower-level parent services and then individual nodes to them.

Click on Add child to add services. To edit an existing service, click on its name. A form is displayed where you can edit the service attributes.
Configuring a service
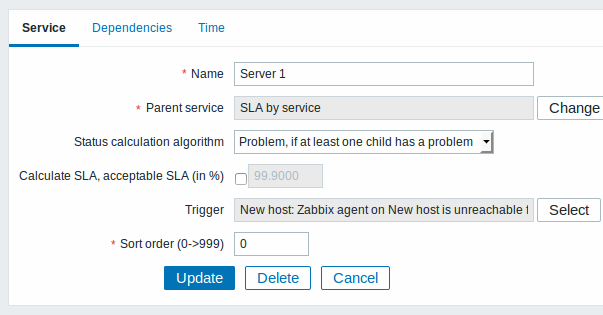
The Service tab contains general service attributes:

All mandatory input fields are marked with a red asterisk.
| Parameter | Description |
|---|---|
| Name | Service name. |
| Parent service | Parent service the service belongs to. |
| Status calculation algorithm | Method of calculating service status: Do not calculate - do not calculate service status Problem, if at least one child has a problem - problem status, if at least one child service has a problem Problem, if all children have problems - problem status, if all child services are having problems |
| Calculate SLA | Enable SLA calculation and display. |
| Acceptable SLA (in %) | SLA percentage that is acceptable for this service. Used for reporting. |
| Trigger | Linkage to trigger: None - no linkage trigger name - linked to the trigger, thus depends on the trigger status Services of the lowest level must be linked to triggers. (Otherwise their state will not be represented accurately.) When triggers are linked, their state prior to linking is not counted. |
| Sort order | Sort order for display, lowest comes first. |
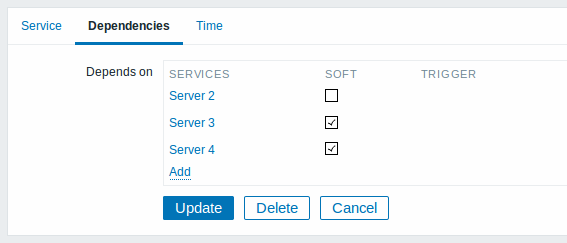
The Dependencies tab contains services the service depends on. Click on Add to add a service from those that are configured.

Hard and soft dependency
Availability of a service may depend on several other services, not just one. The first option is to add all those directly as child services.
However, if some service is already added somewhere else in the services tree, it cannot be simply moved out of there to a child service here. How to create a dependency on it? The answer is "soft" linking. Add the service and mark the Soft check box. That way the service can remain in its original location in the tree, yet be depended upon from several other services. Services that are "soft-linked" are displayed in gray in the tree. Additionally, if a service has only "soft" dependencies, it can be deleted directly, without deleting child services first.
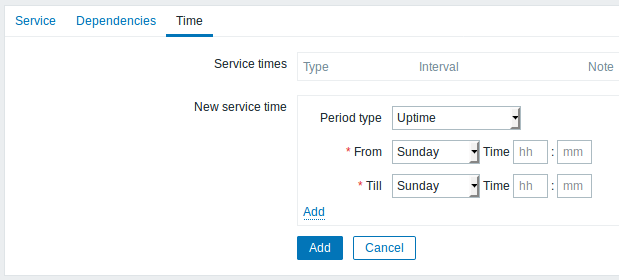
The Time tab contains the service time specification.

| Parameter | Description |
|---|---|
| Service times | By default, all services are expected to operate 24x7x365. If exceptions needed, add new service times. |
| New service time | Service times: Uptime - service uptime Downtime - service state within this period does not affect SLA. One-time downtime - a single downtime. Service state within this period does not affect SLA. Add the respective hours. Note: Service times affect only the service they are configured for. Thus, a parent service will not take into account the service time configured on a child service (unless a corresponding service time is configured on the parent service as well). Service times are taken into account when calculating service status and SLA by the frontend. However, information on service availability is being inserted into database continuously, regardless of service times. |
Display
To monitor services, go to Monitoring → Services.
