
En esta página
3 Gráficos
Descripción general
Se puede acceder a la lista de gráficos personalizados de un equipo desde Configuración → Equpos haciendo clic en Gráficos para el equipo correspondiente.
Se muestra una lista de gráficos existentes.
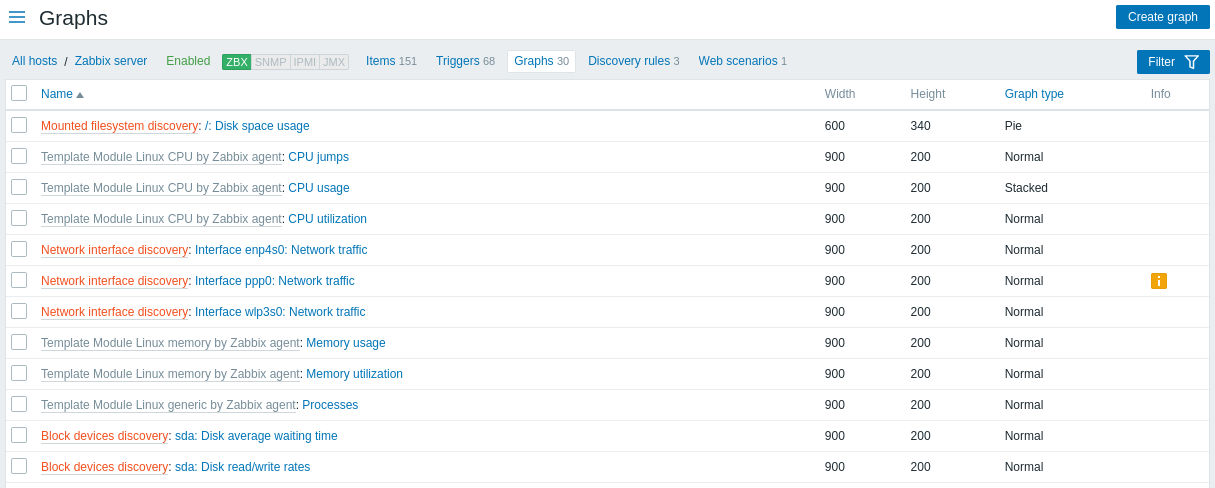
Datos mostrados:
| Columna | Descripción |
|---|---|
| Nombre | Nombre del gráfico personalizado, que se muestra como un enlace azul a los detalles del gráfico. Al hacer clic en el enlace del nombre del gráfico, se abre el formulario de configuración del gráfico. Si el gráfico del equipo pertenece a una plantilla, el nombre de la plantilla se muestra antes del nombre del gráfico, como un enlace gris. Al hacer clic en el enlace de la plantilla, se abrirá la lista de gráficos en el nivel de plantilla. Si el gráfico se ha creado a partir de un prototipo de gráfico, su nombre está precedido por el nombre de la regla de descubrimiento de bajo nivel, en naranja. Al hacer clic en el nombre de la regla de descubrimiento, se abrirá la lista de prototipos de gráficos. |
| Ancho | Se muestra el ancho del gráfico. |
| Alto | Se muestra la altura del gráfico. |
| Tipo de gráfico | Se muestra el tipo de gráfico: Normal, Apilado, Circular o Descompuesto. |
| Información | Si el gráfico funciona correctamente, no se muestra ningún icono en esta columna. En caso de errores, se muestra un icono cuadrado con la letra "i". Pase el cursor sobre el icono para ver una información sobre herramientas con la descripción del error. |
Para configurar un nuevo gráfico, haga clic en el botón Crear gráfico en la esquina superior derecha.
Opciones de edición masiva
Los botones debajo de la lista ofrecen algunas opciones de edición masiva:
- Copiar - copia los gráficos a otros equipos o plantillas
- Eliminar - eliminar los gráficos
Para utilizar estas opciones, marque las casillas de verificación antes de los gráficos respectivos, luego haga clic en el botón requerido.
Usando el filtro
Puede filtrar gráficos por grupo de equipos y equipo. Para una mejor rendimiento de la búsqueda, los datos se buscan con macros sin resolver.